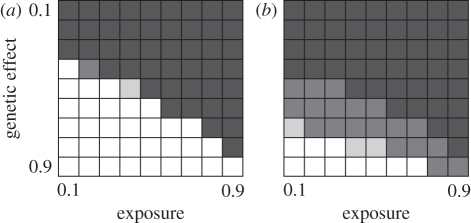
Figure 2.
How the probability of finding a significant genotype–phenotype association for an infectious disease varies with exposure rate and size of genetic effect. (a) Results for a panel of 50 000 SNPs that includes the functional mutation. (b) Results for a CG approach using a sample size of 4000 (equal numbers of cases and controls). For details of simulations and greyscale, see legend of figure 1.

