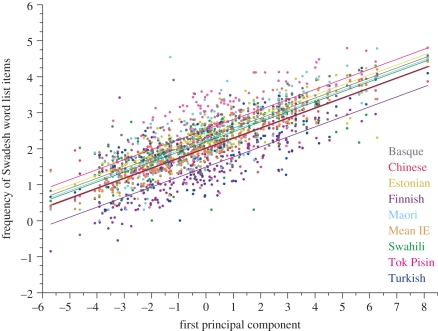
Figure 2.
Log-transformed frequency of use per million words for each of the eight languages plus the Indo-European mean vector of nine languages (see table 1 and text) plotted against the first principal component factor scores of frequencies. The first principal component uses the mean IE-vector together with the other eight languages so as not to bias towards the Indo-European (see text). We fitted regression lines to each language, allowing different intercepts but constraining lines to be parallel simply for illustrative purposes. Fitted this way, the overall relationship accounts for 69.4% of the variance in the principal component. The positive slopes indicate that each language's frequencies of use correlate positively with the principal component that summarizes them. Allowing slopes to vary increases the percentage to 70.3% (not significantly different).

