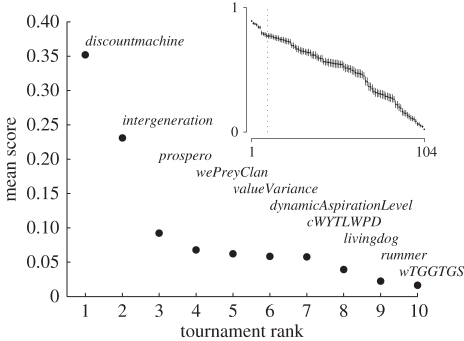
Figure 1.
Performance of entered strategies. Plot shows ranked overall strategy scores in the final stage of the tournament (cWYTLWPD = copyWhenYoungThenLearnWhen-PayoffsDrop and wTGGTGS = whenTheGoingGetsToughGetScrounging). Scores are averaged over all final stage simulations. Inset plot shows mean scores for all 104 entered strategies in the pairwise round; error bars show standard deviation. The dotted black line on the inset indicates the 10 highest scoring strategies. Figure 1a adapted from Rendell et al. [1].

