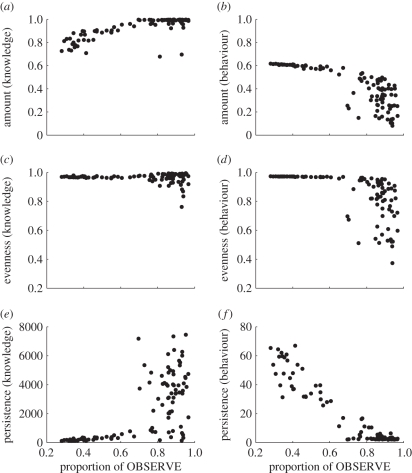
Figure 2.
How effective learning strategies affect culture at the population level. Plots show quantitative measures of the (a,b) amount, (c,d) evenness, and (e,f) longevity of knowledge (a,c,e), and behaviour (b,d,f), plotted against the proportion of learning that was social, in mixed-strategy populations running under the random melee tournament conditions. Each point represents the average value across all iterations for a single 10 000 iteration simulation run. Note the order of magnitude difference in y-axis scales between (e) and (f).

