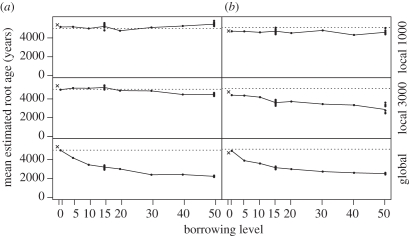
Figure 3.
Mean reconstructed root time for each simulation under three borrowing scenarios: (i) local borrowing within 1000 years, (ii) local borrowing within 3000 years, and (iii) global borrowing. Two different tree topologies were used in the simulations: (a) tree 1 and (b) tree 2. The dotted line marks the true root age and the cross marks the root age under the no borrowing scenario.

