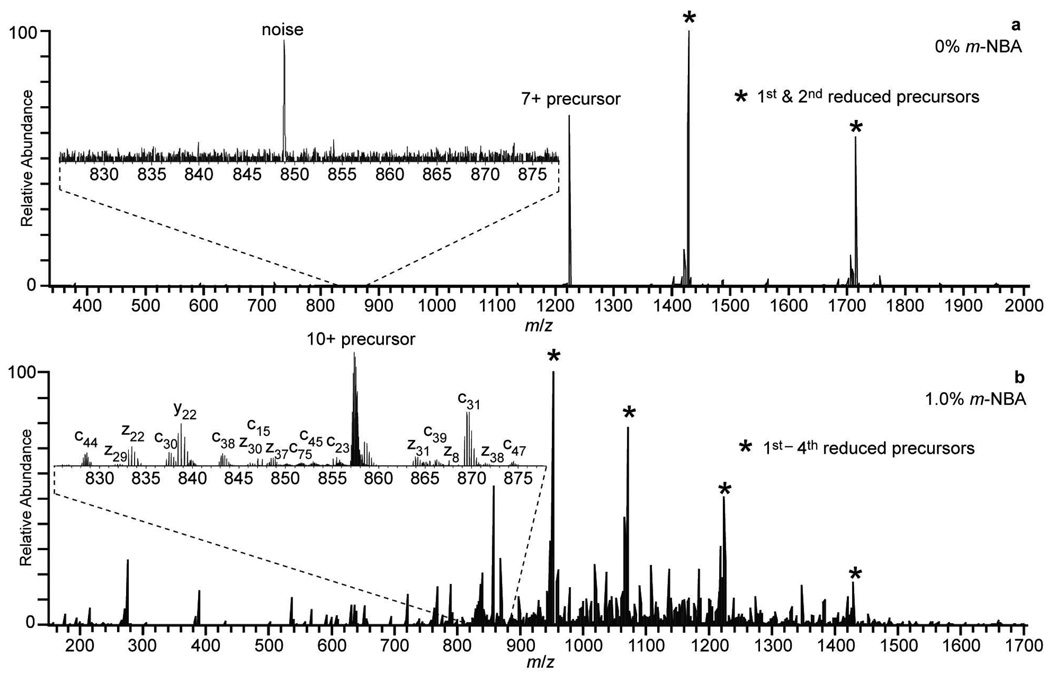
Figure 2.
Electron transfer dissociation mass spectra of the isolated (a) 7+ and (b) 10+ ions obtained from a 3.75 µM ubiquitin, 200 mM ammonium acetate, pH 6.2, solution containing 0% and 1% m-NBA, respectively. In both cases, these were the highest charge states that could be reliably isolated with sufficient S/N to perform ETD. The reduced precursors are indicated with a *. Insets are expansions of the m/z 827 – 877 regions to illustrate differences in fragmentation efficiencies.

