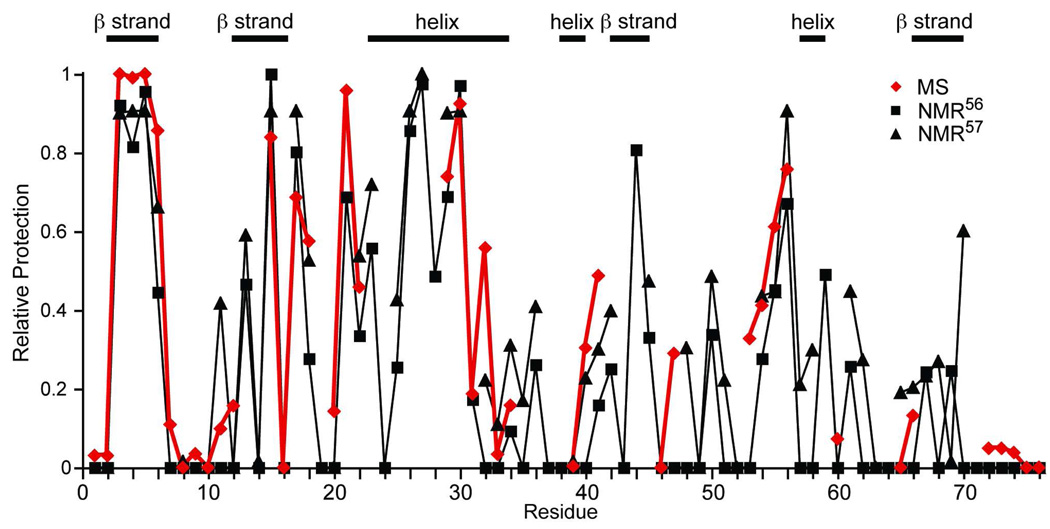
Figure 6.
Comparison of “Relative Protection” from HDX for individual residues obtained by MS (red diamonds), NMR56 (black squares), and NMR57 (black triangles) across the protein sequence. “Relative Protection” is calculated as the (negative) logarithm of the exchange rate constants normalized within a data set.

