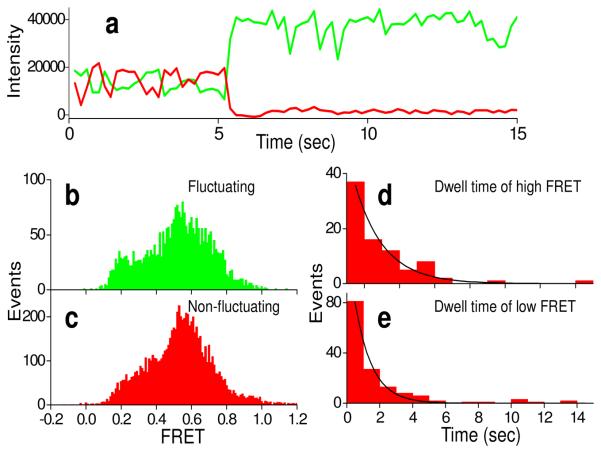
FIGURE 4.
Time courses of fluorescence intensity of pre-complex (PRE-tt, having tRNAArg(Cy3) in P site and fMet-Arg-Phe-tRNAPhe(Cy5) in the A site) close to particles on a small silver particle coated surface (a). Cy3 (green) and Cy5 (red) fluorescence intensity traces under 532 nm laser illumination show fluctuation between high and low FRET and photobleaching of the Cy5 at ~5 s. FRET efficiency distributions from fluctuating and non-fluctuating complexes are shown in (b) and (c), respectively. (d) and (e) are dwell time distributions for high and low FRET states, respectively.

