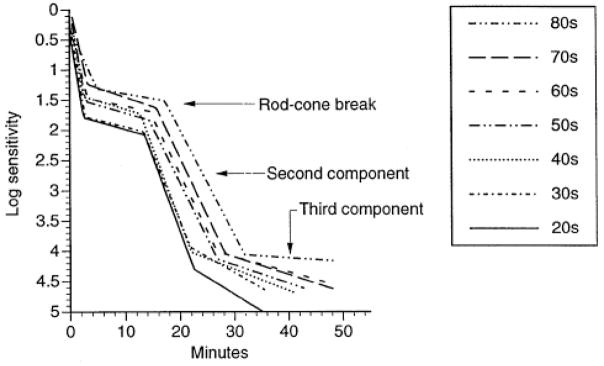
Figure 3.
From Jackson et al. (1999). Dark adaptation as a function of decade. Arrows label the portion of the function representing the rod-cone break and the second and third components of rod-mediated dark adaptation. Note that the funcs shift to the right with increasing decade, indicating a slowing in the rate of dark adaptation during aging.

