
Figure 5.
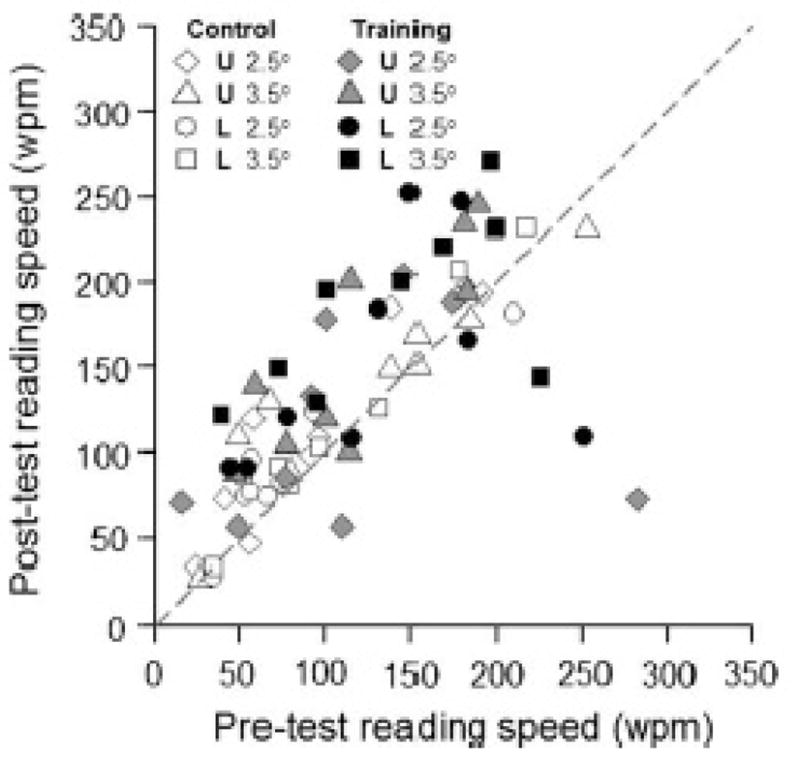
From Yu et al. (2010). Scatterplot showing relationship between pre-training reading speed and post-training reading speed for older adults with normal vision. The reading task was performed at 10° in the periphery. Those undergoing training are solid symbols, controls are open symbols. U and L stand for upper and lower visual field, respectively, for location of the test. 2.5° and 3.5° refer to print size. Note that most filled symbols from the training group are above the diagonal indicating improved reading speeds in older adults following training.