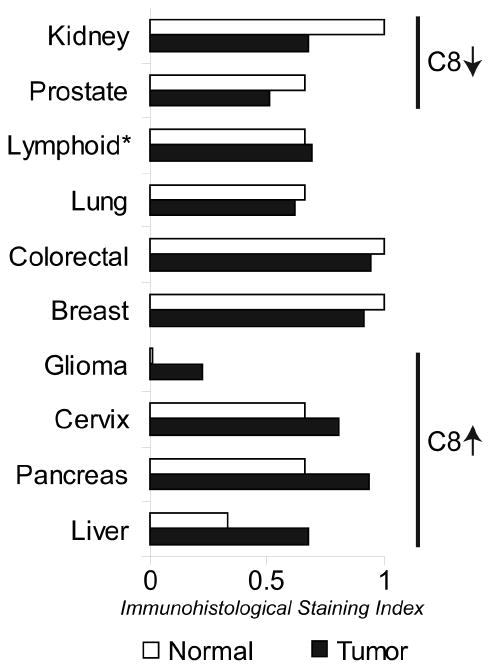
Figure 2. Caspase-8 Expression in Cancer.

The graph shows the relative expression of caspase-8 in normal and neoplastic tissues. Data are derived as a measure of the pathologist-scored immunohistology using antisera to the p10 region of the catalytic domain (HPA001302; staining for full length caspase-8 isoforms). *Lymphoid compares lymphoma to activated lymphoid cells in lymph node reactive centers. Naïve lymphoid cells, outside these regions, do express higher levels of caspase-8 (~1).
