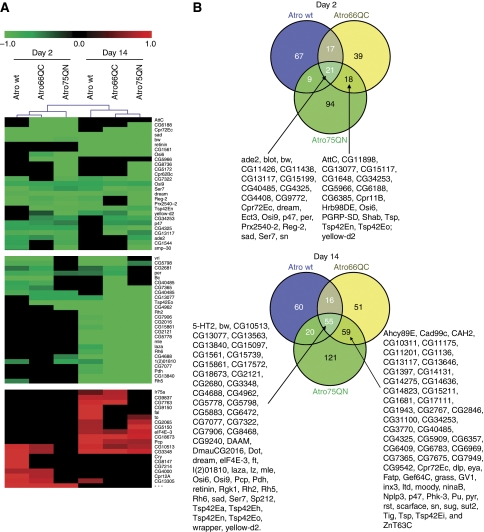
Figure 2.
Global analysis of transcript profiling. (A) Heat maps for three subsets of the pattern clustering analysis generated using the Euclidean Distance metric. Upregulated genes are in red and downregulated genes are in green. The downregulating transcriptional activity increases with time. The main branch in clustering of the different Atro mutants is along time points. See also Supplementary Figure 4. (B) Venn diagrams for the subset of genes affected at the two time points for the different Atro versions with respect to control flies. The overlap between all Atro forms and the two polyQ versions increases with time. The genes in common for all Atro versions or between the polyQ Atro mutants at both times are listed.

