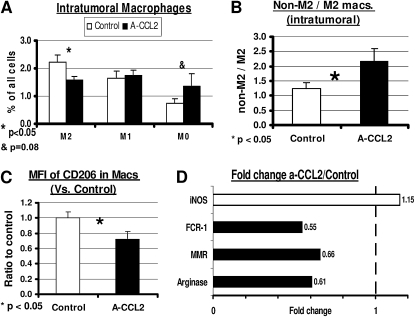
Figure 3.
CCL2 blockade skews the ratio of M1/M2 tumor-associated macrophage (TAM) phenotype. Mice bearing large TC1 tumors were treated with either saline (Control) or intraperitoneal α-CCL2 mAb (A-CCL2). Tumors were analyzed when tumor volume curves started to diverge. (A) Percentages for each of three phenotypes: M0 (CD11b+/Ly6G−/F4/80−), M1 TAMs (CD11b+/Ly6G−/F4/80+/CD206−), and M2 TAMs (CD11b+/Ly6G−/F4/80+/CD206+) out of all tumor cells. The percentage of M2 TAMs was significantly reduced with CCL2 blockade, with a trend toward increased M0 TAMs. (B) Change in ratio of non-M2 to M2 macrophages showed an increased ratio in mice treated with a-CCL2. (C) Reduction was evident in mean fluorescence intensity (MFI) of the M2 TAM marker (the mannose receptor CD206) in mice treated with α-CCL2. (D) Fold changes were evident in the expression of mRNA of several known markers of M1/M2 TAMs in mice treated with α-CCL2, compared with control mice. Three markers of M2 TAMs (solid bars) were reduced to 55–66% of control levels in mice treated with α-CCL2, whereas the M1 marker inducible nitric oxide synthase (iNOS) (open bar) was increased by 15%.

