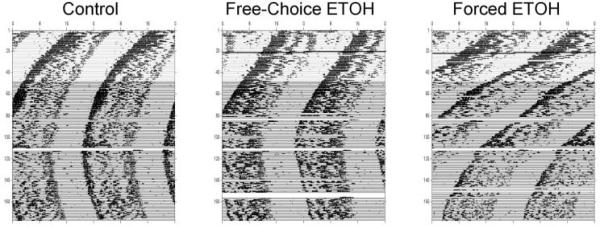
Figure 3.
Representative actograms showing free-running activity rhythms under long-term DD from 1 animal in each of the 3 groups (forced ethanol, free-choice ethanol, and water-only controls). All animals were maintained on plain water for the 1st 3 weeks of the experiment, after which ethanol was continuously available in the forced and free-choice ethanol groups (horizontal line indicates beginning of ethanol treatment on day 22).

