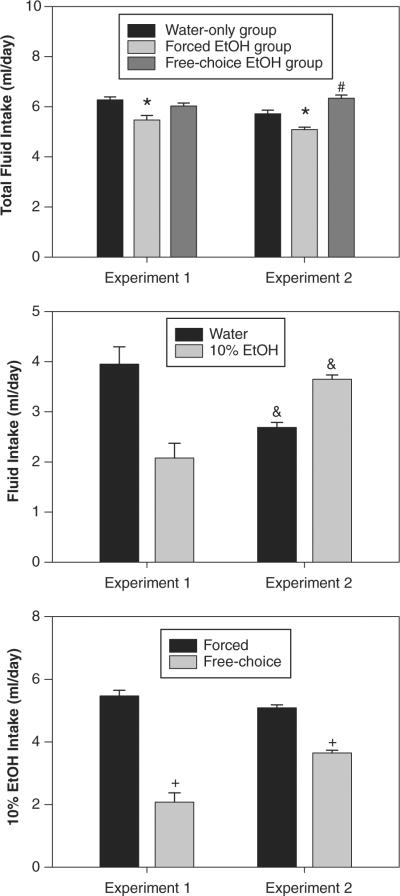
Figure 5.
Mean (± SEM) fluid intakes in both experiments. (Top) Total fluid intake for forced and free-choice ethanol groups and combined water-only controls. (Middle) Water and 10% ethanol intake in free-choice ethanol groups. (Bottom) Ten percent ethanol intake in forced and free-choice ethanol groups. * = forced ethanol group significantly different from both controls and free-choice ethanol groups; # = free-choice ethanol group significantly different from controls; & = experiment 2 significantly different than experiment 1; + = free-choice ethanol group significantly different from forced ethanol group.

