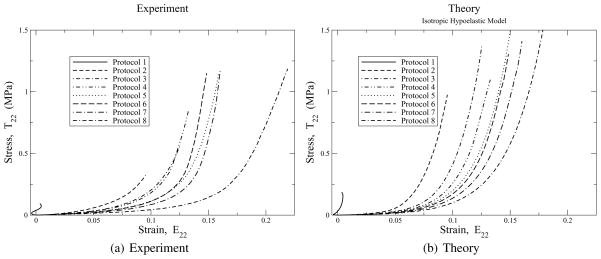
Fig. 8.
Stress/strain curves in the 2-direction for protocols 1 to 8 imposed on glutaraldehyde treated bovine pericardium. Experimental data are the left figure. Predictions of these data with the isotropic hypoelastic model of Eq. (34) are presented in the right figure. The scales of both figures are the same. Parameters are: μ = 27 kPa and β = 19.2.

