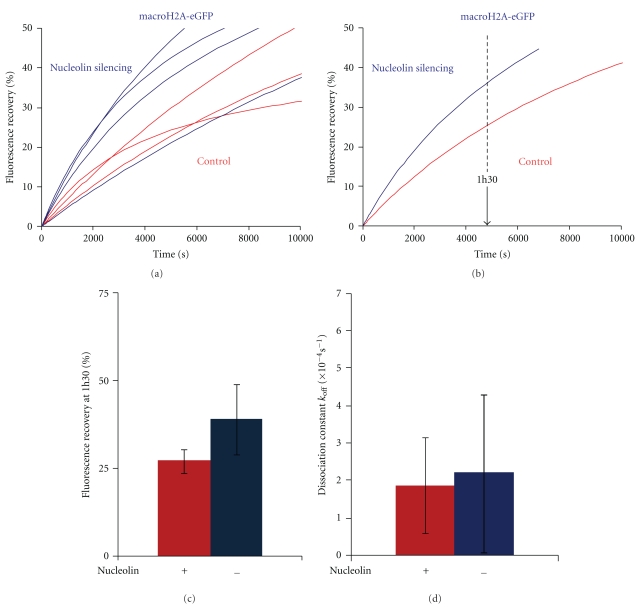
Figure 5.
Nucleolin depletion leads to a faster macroH2A-eGFP fluorescence recovery kinetics. (a) Normalized fluorescence recovery (%) of macroH2A-eGFP in the nucleoplasm of control untransfected cells (red, 3 cells) and in cells transfected with siRNA against nucleolin (blue, 4 cells). Each curve represents the fluorescence recovery of a single cell. (b) Average of the normalized fluorescence curves in (a) control cell (red) and nucleolin-depleted cells (blue). (c) Comparison of the percentage of fluorescence recovery at 1h30 for control cell (red) and nucleolin-depleted cells (blue). (d) Dissociation rate constant values k off (s−1) of macroH2A-eGFP in control untransfected (red) and nucleolin-depleted cells (blue).

