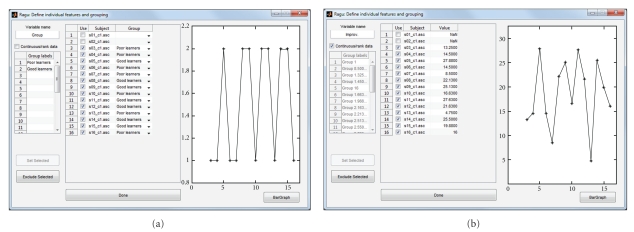
Figure 4.
Specification of the between-subject design of the sample analysis in Ragu. This figure shows the mask for the definition of the between-group design. The variable name appears later on the output of the results. As seen in both examples, no behavioural measures exist for subjects 1 and 2. These subjects are excluded from the analyses by unchecking the “use” checkbox. The line graphs on the right of each example show the value filled in for each subject. (a) The division of subjects in a group of low language proficiency improvement and a group of high language proficiency improvement. The values 1 or 2 are given to each subject as shown in the line graph. (b) For the computation of a TANCOVA, the “continuous/rank data” box has to be checked. Then, the value of proficiency increase from day one to day two can be entered individually. The line graph shows the level of increase of each subject.

