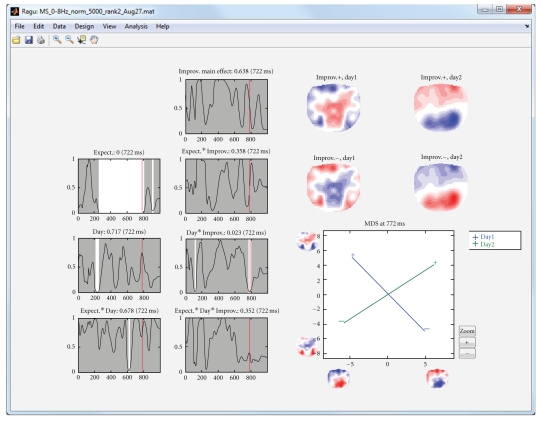
Figure 6.
TANCOVA of the ERPs with the increase of language proficiency. The second row of graphs shows the same information as in Figure 5, with the exception that the effect of language improvement has been taken into account as a linear predictor. Again, the interaction day by improvement shows a late effect now somewhat before 800 ms. The mapping of this interaction on the right side shows the positive and negative covariance maps separately for days 1 and 2. These covariance maps are again entered into an MDS. It appears that there is an almost an orthogonal relation among the language improvement and ERP topography on day 1 and day 2 at this time range.

