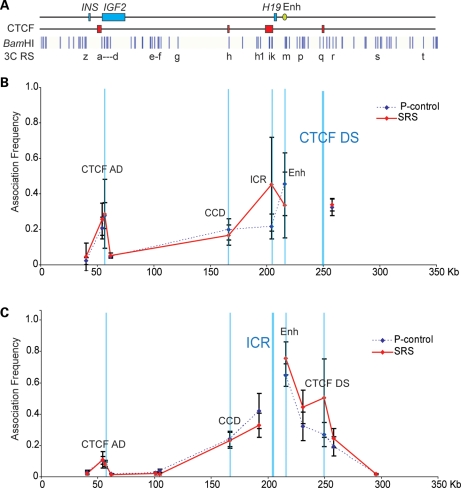
Figure 6.
Looping profile of cell lines from SRS patients with the loss of methylation at the ICR. (A) Locus as in Figure 3. (B) Looping profile at the locus using CTCF DS as anchor shows that SRS cell lines have strong interactions between the CTCF DS and the ICR compared with control. (C) Looping profiles at the locus using ICR as anchor, showing strong interactions between the ICR and the CTCF DS (n= 2 SRS cell lines representing three biological replicates, each sample being processed thrice as technical replicates).

