Figure 4.
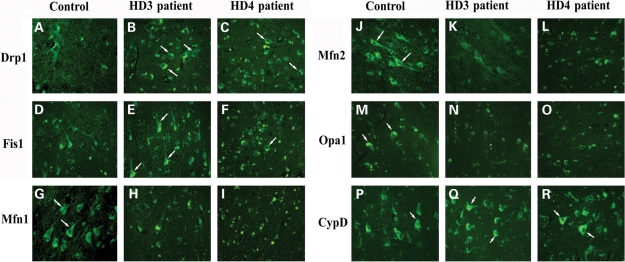
Immunofluorescence analysis of mitochondrial proteins Drp1, Fis1, Mfn1, Mfn2, Opa1 and CypD. Immunoreactivities of Drp1 and Fis1 were increased in frontal cortex sections from grade III (B, Drp1; E, Fis1) and IV HD (C, Drp1; F, Fis1) patients relative to control subjects (A, Drp1; D, Fis1). Mfn1, Mfn2 and Opa1 expressions were decreased in frontal cortex sections from grade III (H, Mfn1; K, Mfn2) and grade IV HD patients (I, Mfn1; L, Mfn2) compared with control subjects (G, Mfn1; J, Mfn2). Immunoreactivity of Opa1 was decreased in grade III (N) and grade IV (O) patients relative to control subjects (M). CypD expression was increased in frontal cortex sections from grade III (Q) and grade IV HD (R) patients relative to control subjects (P). Arrows indicate increased immunoreactivity of proteins. Images were photographed at ×40.

