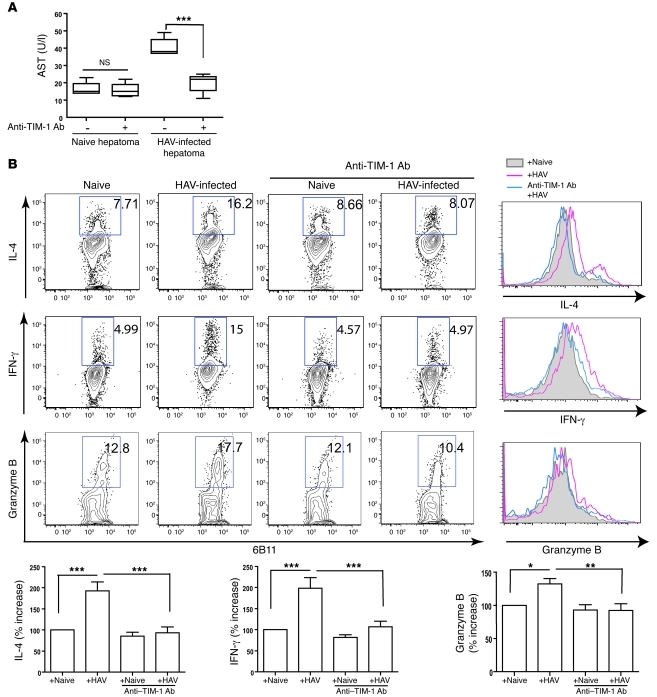
Figure 3. Activation of NKT cells by HAV is TIM-1 dependent.
(A) Anti–TIM-1 mAb blocks the cytotoxicity of NKT cells. NKT cells were incubated with anti–TIM-1 Ab (1D12), which blocks the interaction of TIM-1 with HAV for 1 hour, and then cocultured with naive or HAV-infected hepatoma cells. AST levels were measured using culture supernatant as in Figure 2B. The boundaries of boxes represent the lower and upper quartiles; the lines within the boxes represent the median; and the whiskers represent the lowest and highest value. ***P < 0.001 (ANOVA). (B) NKT cells produce cytokines in a TIM-1–dependent manner. The NKT cell lines were cocultured with HAV-infected or naive hepatoma cells, and HAV–TIM-1 interaction was blocked by anti–TIM-1 mAb (1D12). Intracellular IL-4, IFN-γ, and granzyme B from NKT cells were analyzed. The numbers shown in each dot plot represent the percentage of cytokine-producing NKT cells (within the box). The data in the dot plots are also shown as histograms, where the shaded histogram represents background cytokine production; the red histogram represents cytokine production induced with HAV-infected hepatoma cells; and the blue histogram represents cytokine production after culture with HAV-infected hepatoma cells and with anti–TIM-1 mAb. The data from 4–8 experiments are plotted in the bar graphs (mean ± SEM), as the percent increase in cytokine production compared with cytokine from NKT cells with naive hepatoma cells. *P < 0.05, **P < 0.01, ***P < 0.001 (ANOVA).

