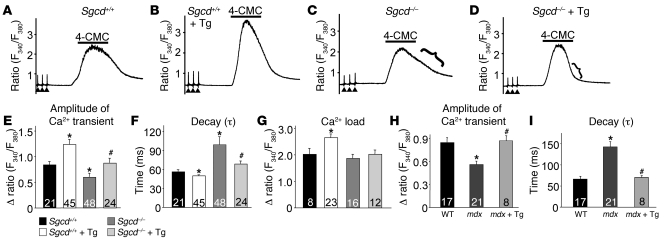
Figure 6. SERCA1 overexpression enhances EC coupling and Ca2+ clearance in Sgcd–/– and mdx myofibers.
(A–D) Representative traces of changes in ratiometric fluorescence ratios in acutely isolated FDB fibers from Sgcd–/– mice in response to electrical and chemical stimulation over time. The brackets in C and D show the Ca2+ reuptake characteristics. (E) Amplitude of the Ca2+ transient after electrical twitch stimulation in the indicated genotypes shown in the legend next to F (applies to E–G). (F) Time constant of decay (τ) and (G) maximal response to 4-CMC in the indicated genotypes as assessed with Fura-2 ratio analysis. *P < 0.05 versus Sgcd+/+; #P < 0.05 versus Sgcd–/–. Number of fibers used in E–G is shown in the graphs. (H) Amplitude of the Ca2+ transient after electrical twitch stimulation in FDB myofibers from mdx and control mice as indicated. *P < 0.05 versus WT; #P < 0.05 versus mdx. (I) Time constant of decay (τ) of the Ca2+ transient in FDB myofibers in the indicated mdx and control groups. *P < 0.05 versus WT; #P < 0.05 versus mdx.

