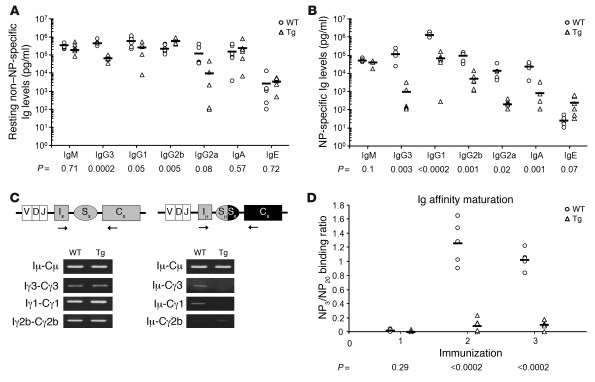
Figure 4. Serum antibody concentration and Ig affinity maturation in ROSA26.vFLIP;CD19.cre mice.
Antibody levels were analyzed by ELISA. P values derived from Student’s t test on the means (bars) of WT versus Tg mice are given below each antibody subclass in the graphs. (A) Resting serum antibody levels evaluated on preimmune serum samples. (B) NP-specific antibody response referred to the second boost. (C) Post-switch transcripts were significantly reduced (right panel), except for Iμ-Cγ2b, although germline transcripts were unaffected (left panel). (D) Tg mice showed lack of affinity maturation upon sequential immunizations performed with NP24-KLH on days 0, 21, and 42, respectively. Higher NP3/NP20 binding ratios indicate the presence of higher-avidity (i.e., affinity-matured) IgG1 antibodies.

