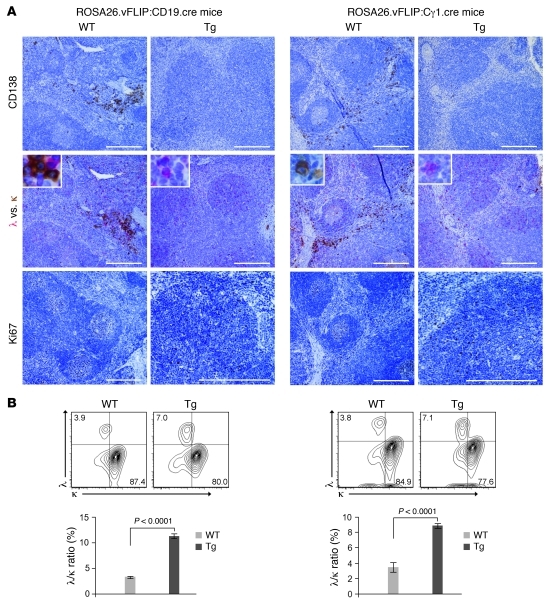
Figure 5. Expansion of Ki67+λ+ B cells.
(A) Spleen sections immunostained with CD138, λ (red), κ (brown), and Ki67. Insert shows higher magnification of cells expressing cytoplasmic λ and κ. Scale bars: 200 μm; 20 μm (insert). (B) Flow cytometry showing percentage of B cells expressing either intracellular λ or κ light chain (upper panel); λ versus κ ratio is also reported (lower panel). Data represent 1 of 3 experiments with similar results (error bars indicate SEM); at least 3 Tg and control animals were analyzed in each experiment.

