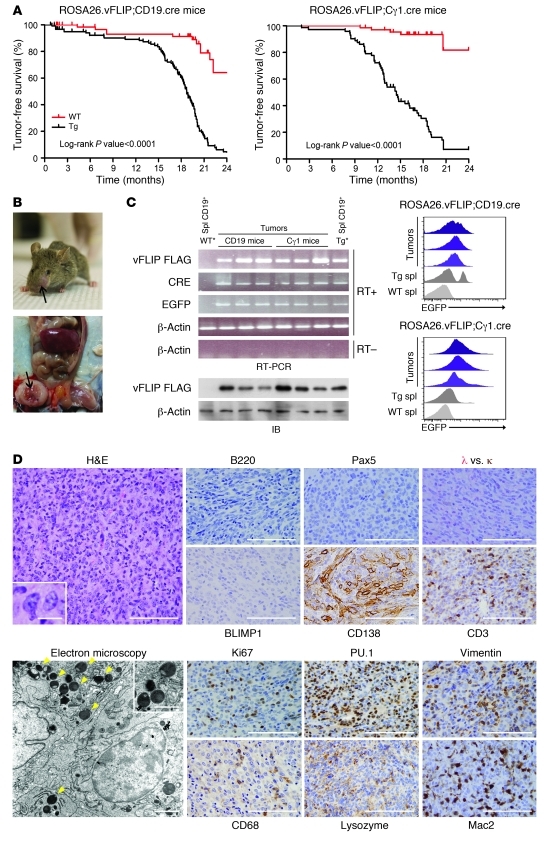
Figure 6. Tumor characterization.
(A) Statistical analysis of event-free survival by Kaplan-Meier cumulative survival curve and the log-rank test to evaluate statistical significance. More than 100 mice in each group were followed up for up to 2 years. (B) A representative tumor in the nose and one in the abdominal cavity are shown. (C) Tg expression was detected in the tumors by RT-PCR (upper left panel), immunoblot (lower left panel), and flow cytometry (right panel). WT* and Tg*, ROSA26.vFLIP;CD19.cre mice were used for negative and positive controls, respectively. (D) Tumor sections were stained with H&E, B cell–specific markers (B220, Pax5, λ and κ), BLIMP1, and CD138 (upper panel). Tumors express markers indicative of histiocytic/DC sarcoma (Pu.1, Vimentin, CD68, Lysozyme, Mac2) (lower panels). Electron microscopy revealed electron-dense vesicles suggestive of lysozymes (arrows) (lower panels). Scale bars: 100 μm, 14 μm (inset), immunohistochemistry images; 2 μm, 1.44 μm (inset), electron microscopy images.

