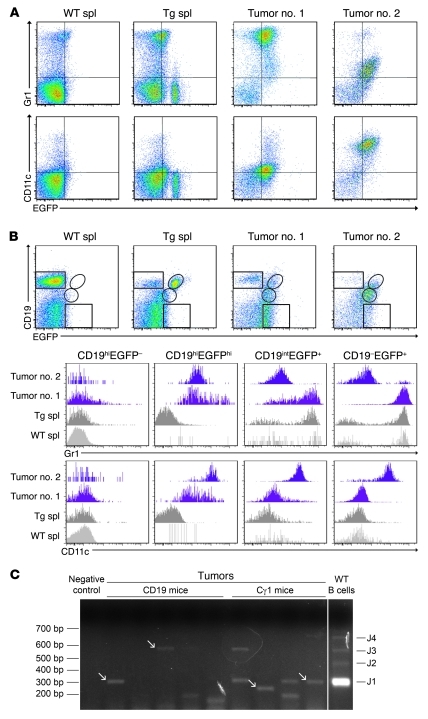
Figure 7. Biphenotypic features of the B cell–derived transdifferentiated tumors.
(A) Flow cytometry showing Gr1 and/or CD11c expression in the EGFP+ tumor cells. Analysis of 2 representative tumors and control WT and Tg spleens is shown. (B) Many tumor cells express intermediate levels of CD19 and are, therefore, biphenotypic (i.e., CD19intGr1+ or CD19intCD11c+). (C) Tumor clonality analysis by RT-PCR with a set of forward primers covering the most commonly used IgVH gene families and reverse primers located in the JH1-4 gene segments. Polyclonal B cells show 4 bands, indicating JH1, JH2, JH3, and JH4 segments were rearranged, while many tumors gave 1 or 2 bands of different size, indicating monoclonal rearrangements. Arrows indicate monoclonal bands. Sample lanes separated by thin white lines were run on the same gel but were noncontiguous.

