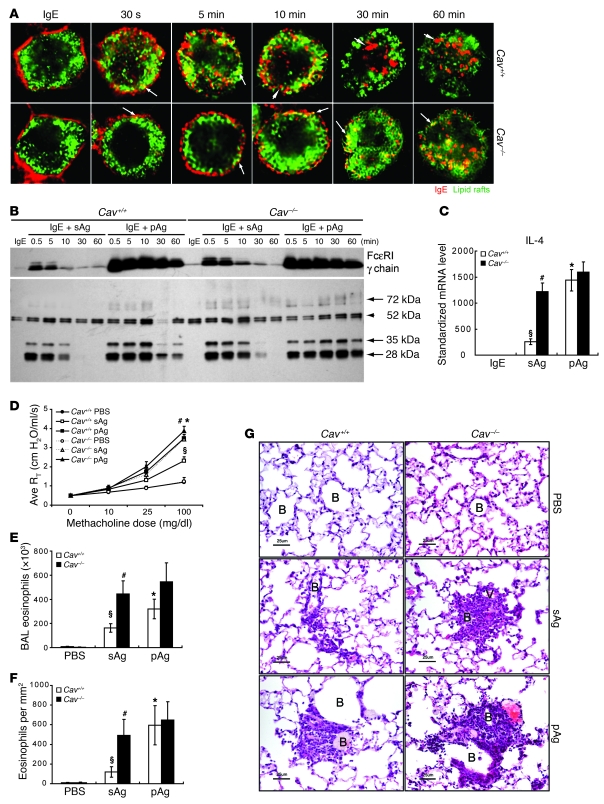
Figure 7. Caveolin 1 deficiency results in enhanced signaling and functional responses of sAgs to levels similar to that induced by pAgs in WT BMMCs.
(A) Association of IgE/FcεRI complexes (red) with lipid rafts (green) in sensitized Cav+/+ and Cav–/– BMMCs at different times after exposure to sAgs. Arrows denote examples of colocalization of IgE/FcεRI complexes with lipid rafts. Arrowheads denote areas in which IgE/FcεRI complexes have separated from lipid rafts. Scale bars: 5 μm. Data are representative of 3 separate experiments. (B) FcεRI-γ chain and tyrosine-phosphorylated proteins in pooled lipid raft fractions from sensitized Cav+/+ and Cav–/– BMMCs challenged with sAgs or pAgs. Arrows denote bands that were enhanced by sAgs in Cav–/– BMMCs. Arrowhead denotes a band that did not appear to change in strength in Cav–/– BMMCs. (C) Levels of IL-4 produced by sensitized Cav–/– and Cav+/+ BMMCs 1 hour after sAg or pAg exposure (n = 4). AHR response (D), BAL eosinophil counts (E), and lung histology (F) evoked by sAgs or pAgs in sensitized Wsh mice reconstituted with Cav–/– BMMCs or Cav+/+ BMMCs (n = 5). (C–F) §P < 0.01 versus vehicle controls; *P < 0.01 versus Cav+/+ sAg; #P < 0.01 versus Cav+/+ sAg. (G) Histology of lungs from sensitized Wsh mice reconstituted with Cav–/– BMMCs or Cav+/+ BMMCs after exposure to sAgs or pAgs. Samples were stained with H&E. Eosinophil accumulation around small bronchioles and vasculature is denoted. Each histological photomicrograph is representative of 4 mice. Scale bars: 25 μm.

