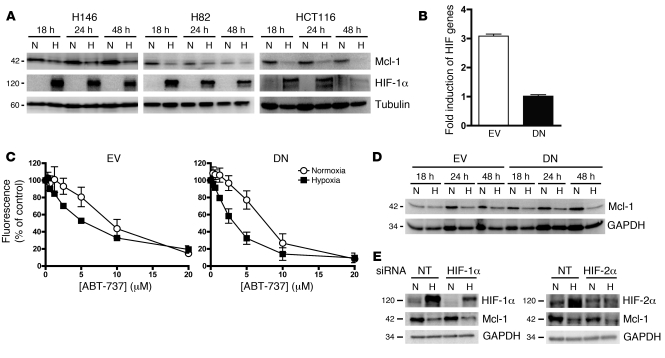
Figure 4. Effect of hypoxia and HIF-1 on Mcl-1 protein expression levels.
(A) Effect of hypoxia on Mcl-1 and HIF-1α protein levels after 18, 24, or 48 hours hypoxia (1% O2) or normoxia. (B) Validation of HCT116 cell line expressing DN HIF-1α protein. HCT116 EV control and HCT116 DN HIF-1α cells were incubated in hypoxia (1% O2) or normoxia for 18 hours, after which the fold induction of firefly luciferase in hypoxia was calculated over that of Renilla luciferase (see Methods). (C) HCT116 EV or HCT116 DN HIF-1α cells were incubated in normoxia or hypoxia (1% O2) for 18 hours, after which they were exposed to a range of ABT-737 concentrations under continuous normoxia or hypoxia for 72 hours prior to determination of IC50 values using the SRB assay. (D) Western blot analysis of Mcl-1 expression level in HCT116 EV and HCT116 DN cells after 18, 24, or 48 hours hypoxia (1% O2) or normoxia. (E) HCT116 cells were treated with HIF-1α or HIF-2α or NT siRNA for 24 hours, and then siRNA was removed and cells were incubated in normoxia or hypoxia for 24 hours, after which cells were harvested and levels of HIF-1α, HIF-2α, Mcl-1, and GAPDH were determined by Western blot. Data are mean ± SEM of 3 independent experiments.

