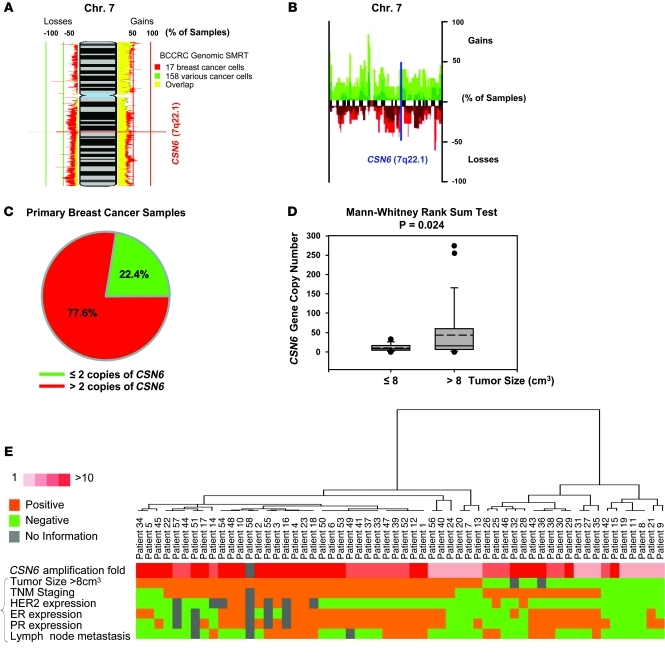
Figure 1. Amplification of CSN6 gene copy number in human breast cancers.
(A) SIGMA analysis of the CSN6 gene loci was performed on a CGH data set of BCCRC SMRT arrays. 100%, gain of that locus in all samples; –100%, loss of that locus in all samples. (B) Regions of gains and loss (at 0.9 megabase resolution) across chromosome 7 in a set of 47 primary breast cancer samples and 18 breast cancer cell lines are shown. Figure adapted from Breast Cancer Research (31). Red, recurrent loss, green, recurrent gain. (C) CSN6 gene copies were assessed in a cohort of 58 primary human breast cancer genomic DNA samples, and the frequency of human breast cancer samples with or without CSN6 gene amplification is shown. (D) Amplification of the CSN6 gene was associated with tumor size larger than 8 cm3 at the time of surgical resection in the cohort examined in C. Bounds of the boxes denote interquartile range; solid and dashed lines denote median and mean, respectively; whiskers denote 90% and 10%; symbols denote outliers. (E) Hierarchical clustering was performed on the cohort examined in C with the indicated pathological and genomic markers; data are presented as a heat map.

