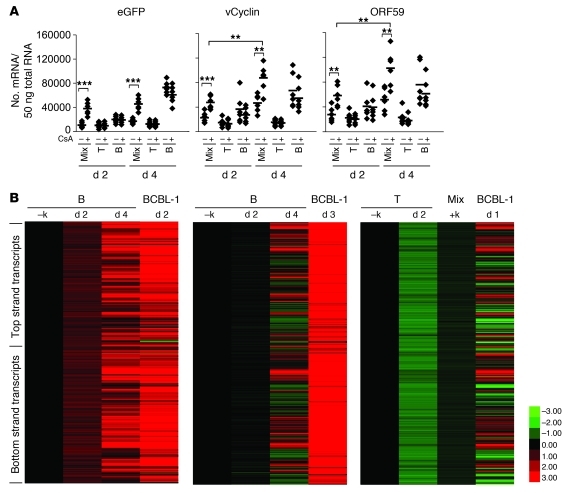
Figure 2. Viral gene expression in infected tonsillar cells.
(A) Copy numbers of eGFP, vCyclin, and ORF59 mRNA were determined by real-time quantitative PCR after gene-specific reverse transcriptase reactions on 50 ng of DNase-treated total RNA from fractionated T or B cells or unfractionated tonsillar cells (Mix) at the indicated time points; the cells were infected as described in Figure 1. Cells were treated with CsA for the indicated duration. Dots represent data from each individual tonsil. The mean of data from 6 different tonsils is indicated by the horizontal bar. **P < 0.01; ***P < 0.001 by Student’s t test. (B) Mixed cells or purified CD19+ B and CD3+ T cells were infected with rKSHV.219 as described in Figure 1 and Methods. At day 2 and day 4 after infection, total RNA was extracted and subjected to tiling microarray with linear amplification (for details, see Methods). –k, no viral infection. Total RNA from BCBL-1 cells, which were induced to lytic replication by Val (600 μM) for 1–3 days, was included as a positive control. KSHV tiling microarray data (ordered by genome position) are displayed for 13,444 unique probes. The color bar indicates the fold change relative to the level for the uninfected B cells. 2 independent experiments for B cells are shown. Array data for T and mixed cells are 1 representative of 2 independent experiments.

