
Figure 2.
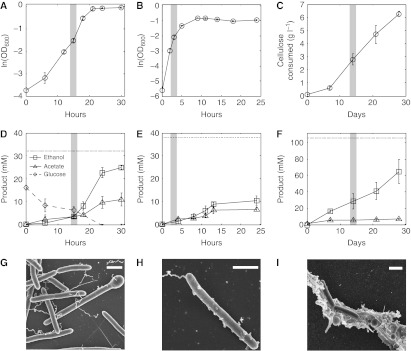
Growth (A–C), fermentation (D–F), and cell morphology (G–I) of C. phytofermentans on different carbon sources. Data points are means of triplicate cultures; error bars show one s.d. and are smaller than the symbols where not apparent. Gray bars show when samples were taken for mass spectrometry. Growth on glucose (A) and hemicellulose (B) was quantified as OD600. Growth on cellulose (C) was measured as dry mass of cellulose in culture. Production of ethanol and acetate, the two most abundant fermentation products, and glucose consumption in the glucose treatment was measured by HPLC. Dotted lines show maximum theoretical yield of ethanol. Scanning electron microscopy shows cells growing on glucose (G), hemicellulose (H), and cellulose (I). White scale bar is 1 μm.