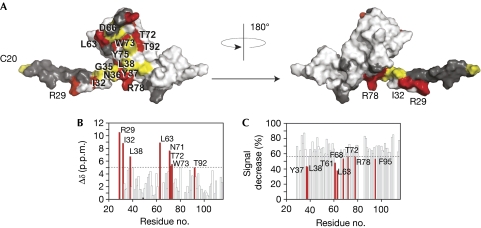
Figure 4.
The BamD binding site. (A) Surface representation of BamE. Residues shown by 1H,15N-resolved NMR that interact with BamD are shown in red, as estimated by showing either CS perturbations or specific line broadening. Residues shown by mutagenesis to be critical for function are shown in yellow. Residues in dark grey were either not assigned or not measured because of signal overlap. (B) Histogram showing normalized CS perturbations induced in 15N-labelled BamE (70 μM) after addition of BamD (200 μM). (C) Histogram showing specific line broadening of 15N-BamE residues (70 μM) on addition of BamD (200 μM). Residues larger than 1 s.d. from the mean (dashed line) were considered significant and are highlighted in red. Bam, β-barrel assembly machine; CS, chemical shift.

