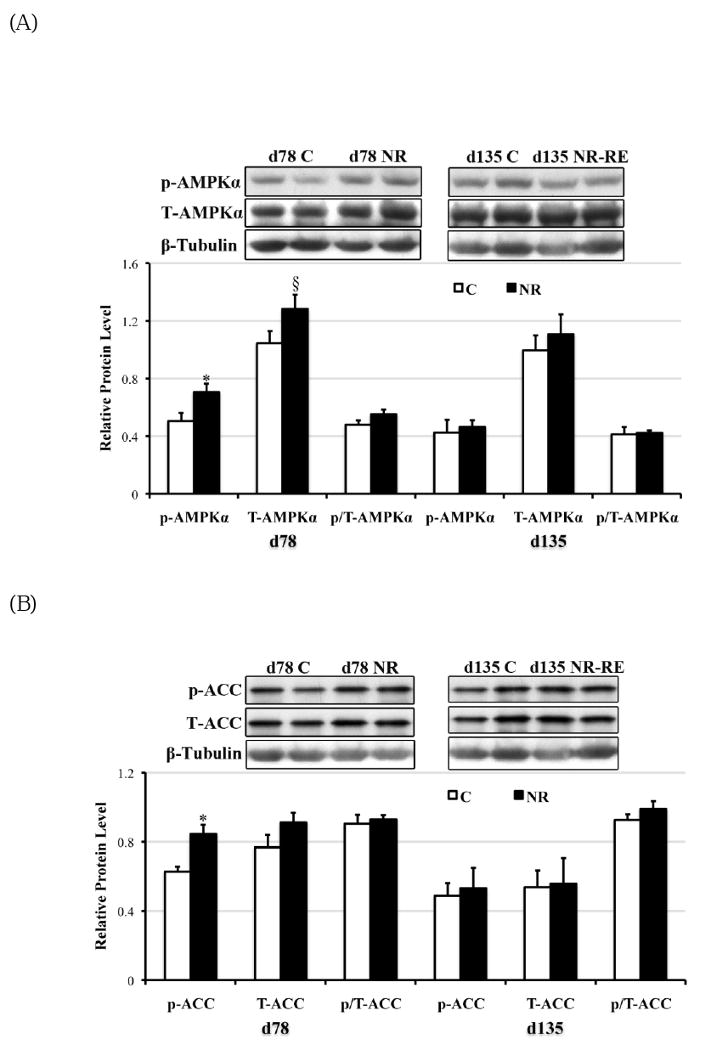
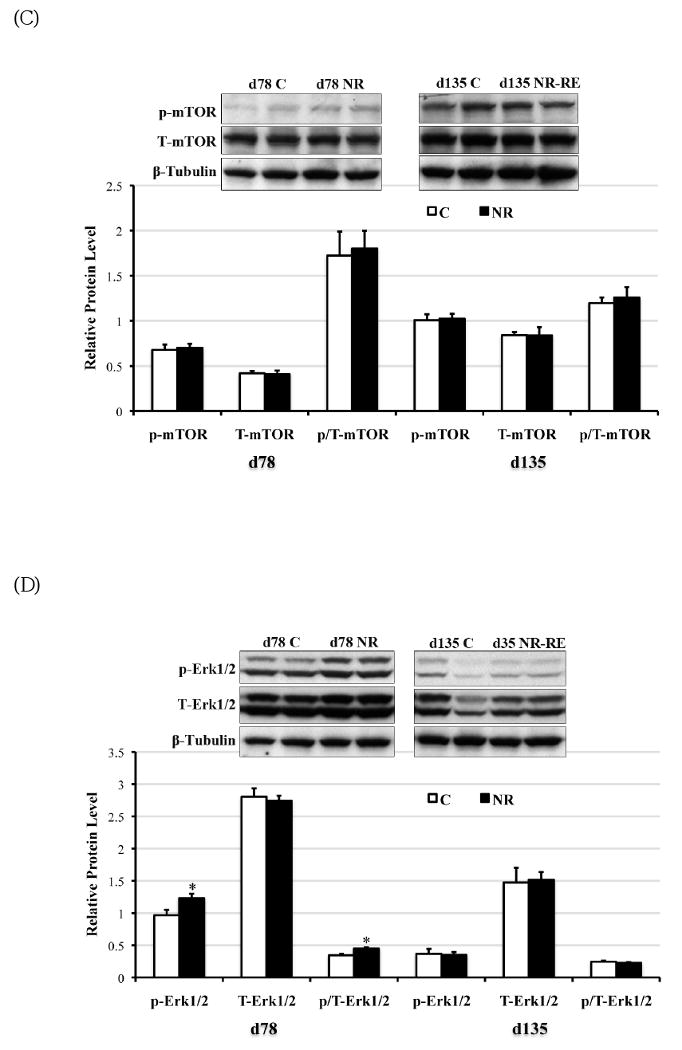
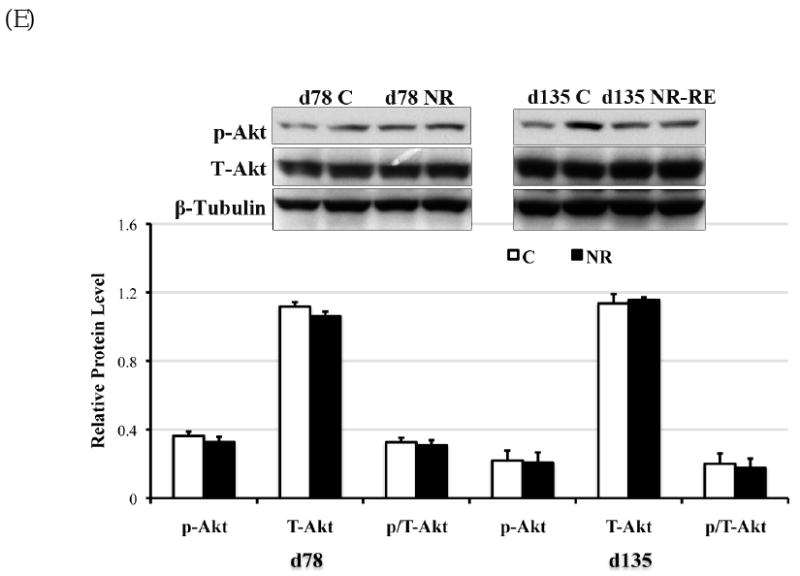
Figure 5.


Phosphorylated form (lowercase ‘p’), total form (capitalized ‘T’), and the phosphorylated to total form ratio (p/T) of (A) AMPKα (∼60 kDa); (B) ACC (∼280 kDa); (C) mTOR (∼280 kDa); (D) Erk1/2 (42kDa and 44kDa); and (D) Akt (∼60 kDa) in COT tissues of day 78 C and NR ewes (n = 8) and day 135 C and NR-RE ewes (n = 4). *Means ± SEM differ (P < 0.05). § Means ± SEM tends to differ (P < 0.10).
