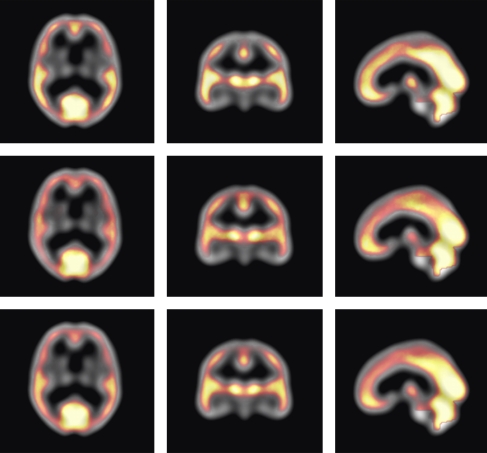
Figure 1.
Base image (grayscale colormap): registration reference. Overlay image (colormap ranging from red to white): voxels with top 25% intensities within the whole-brain region. The color indicates how often a voxel is used across all data sets. Voxels in the occipital lobe and the cerebellum are most frequently among the voxels used for intensity normalization (upper row: all Alzheimer's disease (AD) data sets; middle row: all asymptomatic control data sets; and lower row: both AD and control data sets). The color reproduction of this figure is available on the html full text version of the manuscript.

