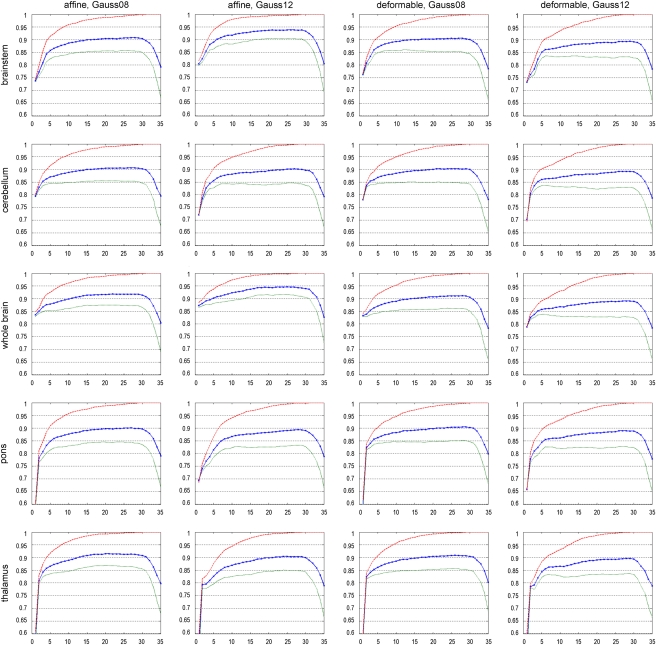
Figure 2.
Classification accuracy of the training set (red, dashed), for individual bootstrap samples (averaged) (green, dotted), and for the bootstrap 0.632 estimator (corrected, averaged) (blue, solid with crosses), depending on the number of principal components (PCs) included into the analysis. In each plot, the horizontal axis denotes the number of PCs included into the analysis, and the vertical axis denotes the respective classification accuracy. The color reproduction of this figure is available on the html full text version of the manuscript.

