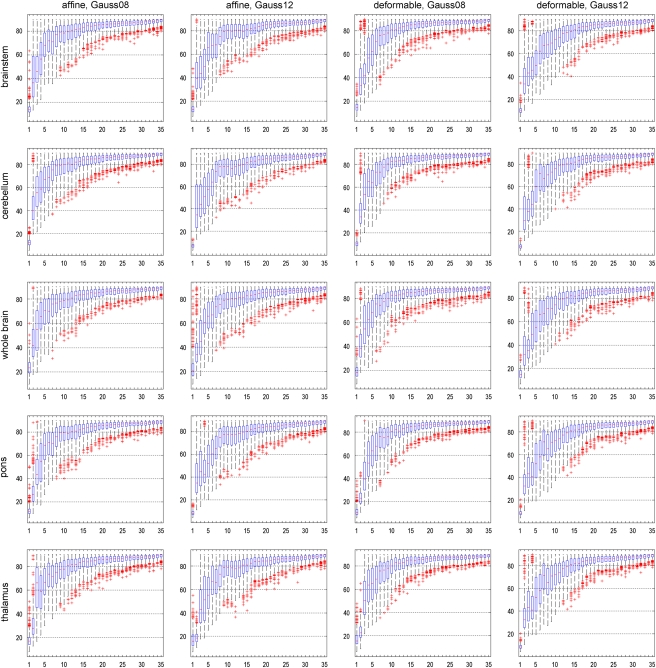
Figure 3.
For different data preprocessing methods: sampling distribution of the angle between principal component analysis (PCA) subspaces for 500 bootstrap replications, depending on the number of PCs. Robustness is indicated by a small angle between PCA subspaces, and a comparatively narrow distribution. In each boxplot, the horizontal axis denotes the number of PCs included into the analysis, and the vertical axis denotes the angle between PCA subspaces.

