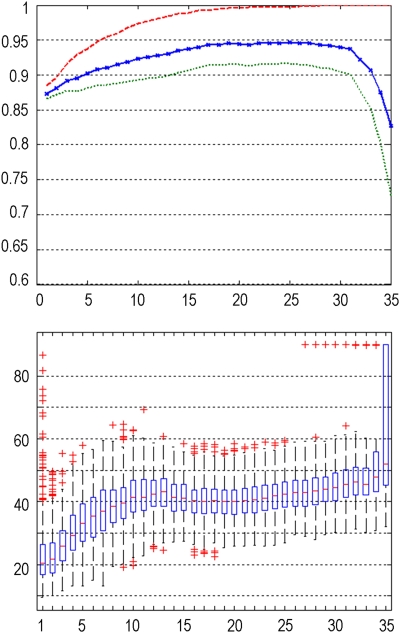
Figure 5.
Direct comparison of the classification accuracy (upper image) and the angle between Fisher discriminant analysis (FDA) vectors (lower image) clearly shows the trade-off relationship between both (exemplarily, data preprocessing using whole-brain intensity normalization, affine registration, and Gaussian smoothing, with a full width half maximum (FWHM) of 12 mm was used). In both plots, the horizontal axis denotes the number of principal components (PCs) included into the analysis, and the vertical axis denotes the respective classification accuracy (upper plot) and the angle between FDA vectors (lower plot), respectively.

