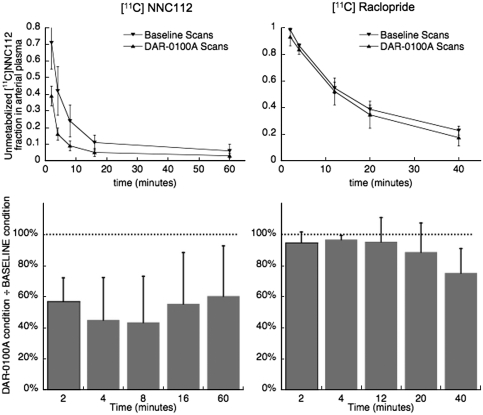
Figure 3.
Unmetabolized fraction of radiotracer in arterial plasma as a function of time. DAR-0100A caused a pronounced increase in the rate of metabolism of [11C] NNC112 (left) but only a slight increase for [11C] raclopride (right). Top: markers (▾=baseline, ▴=DAR-0100A condition) and error bars are mean±s.d. across n=6 baseline and n=6 DAR-0100A scans for [11C] NNC112 and n=3 baseline and n=3 DAR-0100A scans for [11C] raclopride. Continuous curves are for visual display only and do not represent statistically modeled fits. Bottom: unmetabolized fraction of radioligand during DAR-0100A condition as a percentage of the fraction during the baseline scan.

