Abstract
We examined the mechanisms underlying the abrupt onset of the focal infarction in disseminated selective neuronal necrosis (DSNN) after temporary ischemia. Stroke-positive animals were selected according to their stroke-index score during the first 10 minutes after left carotid occlusion performed twice at a 5-hour interval. The animals were euthanized at various times after the second ischemia. Light- and electron-microscopical studies were performed chronologically on the coronal-cut surface of the cerebral cortex at the chiasmatic level, where focal infarction evolved in the maturing DSNN. We counted the number of neurons, astrocytes, and astrocytic processes (APs); measured the areas of end-feet and astrocytes; and counted the numbers of obstructed microvessels and carbon-black-suspension-perfused microvessels (CBSPm). Between 0.5 and 5 hours after ischemia, DSNN matured, with the numbers of degenerated and dead neurons increasing, and those of APs cut-ends decreasing; whereas the area of the end-feet and the numbers of obstructed microvessels increased and those of CBSPm decreased. At 12 and 24 hours after ischemia, the infarction evolved, with the area of end-feet and astrocytic number decreased; whereas the numbers of obstructed microvessels decreased and the CBSPm number increased. The focal infarction evolved by temporary microvascular obstruction because of compression by swollen end-feet.
Keywords: disseminated selective neuronal necrosis, evolution of focal infarction, maturation phenomenon, microvascular compression, swollen end-feet, temporary cerebral ischemia, tPA
Introduction
The maturation phenomenon of ischemic injury (Ito et al, 1975, 1979) or delayed neuronal death (Kirino, 1982) has been investigated with the main focus on neurons. However, astrocytes are known to support neuronal functions by regulating extracellular ion-homeostasis and neurotransmitters, as well as by providing energy substrates, for example, lactate to the neurons through their astrocytic processes (APs; Auer and Sutherland, 2002; Bambrick et al, 2004; Chen and Swanson, 2003). An ischemic insult also injures astrocytes; however, no precise analysis of the APs had been reported before our earlier study (Ito et al, 2009). In that study of the region peripheral to the cerebral cortical infarction (region peripheral to the infarction, RPI) or penumbra in Face-B (the coronal-cut surface of the gerbil brain at the level of the chiasma was termed as Face-A and that at the level of the infundibulum as Face-B), we found that the heterogeneous degeneration of APs of the normal-appearing astrocytes was tightly associated with the appearance of disseminated selective neuronal necrosis (DSNN) and its maturation after temporary ischemia.
Two types of morphological injury, DSNN and infarction, have been demonstrated in response to various temporary ischemic insults (Ito et al, 1975; Marcoux et al, 1982; DeGirolami et al, 1984). In temporary ischemia, brief moderate ischemia induces DSNN, whereas longer and severer ischemia produces an infarction (Ito et al, 1975; Marcoux et al, 1982; DeGirolami et al, 1984; Smith et al, 1984). Excitatory amino acids are thought to lead to DSNN; and tissue acidosis, to an infarction. However, the pathologic relationships between the two may not always be straightforward (Auer and Sutherland, 2002).
Infarction is defined as a pan-necrosis of both glial and neuronal elements and is different from DSNN in that astrocytes also die during the evolution of an infarction. Impairment of energy metabolism, as evidenced by reduced glucose utilization, progressive acidosis, and ATP depletion, has a pivotal function in the formation of an infarction. However, little is known about the mechanisms underlying the abrupt onset of astrocytic death and pan-necrosis in the DSNN (Auer and Sutherland, 2002; Swanson et al, 1997).
For thrombolytic therapy in acute stroke, prevention of the evolution of a focal infarction after restoration of blood flow is of paramount importance for a better recovery. Elucidation of the mechanisms and identification of targets for prevention of the abrupt onset of the focal infarction, and as well as the development of novel preventive measures, will have tremendous clinical implications for the treatment of acute stroke.
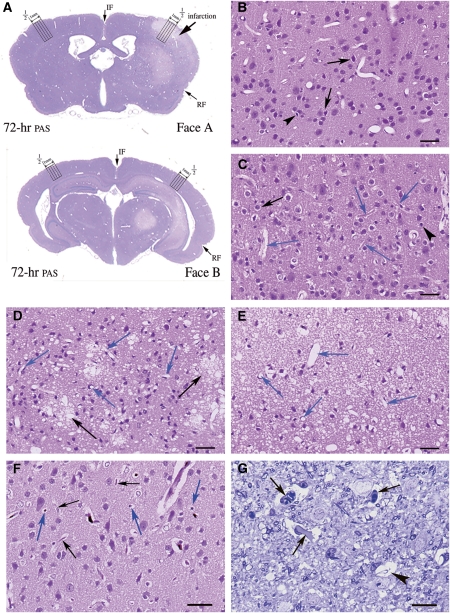
Because of the difficulty involved in reproducibly producing either DSNN or an infarction in the cerebral cortex of experimental animals by imposing a single ischemic insult (Crowell and Olsson, 1972; Weinstein et al, 1984), we earlier devised a model that uses a modified, unilateral temporary carotid occlusion in Mongolian gerbils obtained by applying twice a 10-minute unilateral carotid occlusion with a 5-hour interval between them. This procedure afforded a threshold amount of ischemia needed to induce a unilateral cerebral cortical focal infarction in Face-A, around which DSNN slowly matured in a large RPI/or penumbra. The infarct size became uniform so that a focal infarction evolved in the DSNN of the coronal face sectioned at the chiasmatic level (Face-A; Figure 1A), and only DSNN matured in the coronal face sectioned at the infundibular level (Face-B; Figure 1A; Hanyu et al, 1997). In this model, by dividing the ischemic insult into two parts, the mortality rate of the animals caused by epileptic seizure is drastically decreased.
Figure 1.
Light microscopic findings in the second to fifth cortical layers of Face-A. (A) Coronal section of Face-A and -B 72 hours after ischemia (periodic acid-fuchsin-Schiff, PAS). The four cortical columns counted, each 0.25 mm in width, are indicated. ‘1/2' indicates the point medial between rhinal (RF) and interhemispheric (IF) fissures along the cortical surface. (B–E) Hematoxylin-eosin (HE) staining; bars=30.4 μm. (B) At 0.5 hour after ischemia, degenerated (arrows) and dead (arrowheads) neurons are seen. (C) At 5 hours after ischemia, degenerated (black arrows) and dead (arrowhead) neurons are seen along with obstructed microvessels showing stasis and surrounded by swollen end-feet (blue arrows). (D) By 12 hours after ischemia, flocks of foamy necrotic neuropils (black arrows) are noted among necrotic neurons. Blue arrows indicate patent microvessels. (E) At 24 hours after ischemia, dead neurons are scattered in diffusely spongy necrotic tissue. Almost all microvessels are patent (blue arrows). (F) At 3 hours after ischemia: carbon-black-suspension perfused (CBSP) and HE, bars=30.4 μm. Carbon-black-suspension-perfused (blue arrows) and not-perfused (black arrows) microvessels are seen. (G) At 5 hours after ischemia, signs of stasis (arrows) and obstructed microvessels (arrowhead) are observed (Toluidine blue), bars=12.2 μm.
In our earlier studies, we found that the threshold from DSNN to focal infarction after temporary ischemic insult was very narrow and that a small increase in the ischemic insult induced an infarction once a critical threshold of the intensity had been met (Hanyu et al, 1995, 1997). However, the temporal profile and mechanisms of transition from the maturing DSNN to evolution of the focal infarction still remained obscure. Our earlier study using the same gerbil model also revealed that, around 12 hours after ischemia, an abrupt drop in ATP content, SDH activity, and pH occurred in the cerebral cortex of gerbils at the chiasmatic level (Face-A) corresponding to the focal infarction, suggesting that some additional event had occurred in the cortical tissue (Kuroiwa et al, 2000).
Using this model, we presently investigated this transition, focusing on the ultrastructural temporal profiles of the astrocytic end-feet and patency of the microvessels during the appearance of a focal infarction in the maturing DSNN in Face-A, to elucidate the additional event that was required to induce the abrupt onset of the infarction.
Materials and methods
The animals used here were handled in accordance with the ‘Guidelines for the Experimental Use of Animals of Tokyo Metropolitan Institute for Neuroscience.' Animals were numbered and grouped by using a table of random numbers. Also using this table, an outsider numbered each specimen for light microscopy (LMS) and electron microscopic (EM) photographs in each of the settings, with measurements performed starting with the smallest number. Under anesthesia with 3% isoflurane, 70% nitrous oxide, and 30% oxygen, the left carotid artery of adult male Mongolian gerbils (60 to 80 g) was exposed by making a midline cervical incision. The carotid artery was occluded twice with a Heifetz aneurismal clip for 10 minutes each time, with a 5-hour interval between the two occlusions.
Anesthesia was discontinued immediately after each cervical surgery, and the behavior of conscious animals was observed for 10 minutes during the carotid occlusion. Ischemia-positive animals were selected based on having a stroke-index score of over 13 points (Ohno et al, 1984). These animals were killed at 0 (sham operated), 0.5, 3, 5, 12, 24, and 72 hours after the second ischemic insult, by transcardiac perfusion. The animals were perfused with diluted fixative (1% paraformaldehyde, 1.25% glutaraldehyde in 0.1 mol/L cacodylate buffer) for 5 minutes, followed by perfusion with concentrated fixative (4% paraformaldehyde, 5% glutaraldehyde in 0.1 mol/L cacodylate buffer) for 20 minutes for EM (three animals for each time group) or with 10% phosphate-buffered formaldehyde fixative for 30 minutes for LMS (four animals for each time group).
For the EM study, we obtained cortical blocks including all cortical layers along a 2-mm-wide path from a point medial to one-half of the distance between the rhinal and interhemispheric fissures of the left cerebral cortex on Face-A. These blocks were divided into two adjacent column blocks of 1 mm width for each and embedded into Epon blocks. Ultrathin Epon sections including second through fifth cortical layers were double stained with uranyl acetate and lead solution, and observed with an electron microscope (H9000-Hitachi, Tokyo, Japan). A measure of 1-μm thick Epon sections of these column blocks were stained with Toluidine blue for LMS. Coronary paraffin sections of Face-A were separately stained with hematoxylin-eosin or periodic acid-fuchsin-Schiff for LMS.
We performed the following morphometric measurements.
Number of Normal-Appearing, Degenerating, and Dead Neurons and of Astrocytes (Light Microscopy)
Using an eye-piece micrometer (U-OCMSQ10/10) under 400-power magnification, we counted the number of normal-appearing, degenerated, and dead neurons in all six cortical layers in four adjacent columns, by vertically and medially moving the specimen along a 0.25-mm-wide × 4 path of the cortex. We started medially from a point one-half of the distance between the rhinal and interhemispheric fissures on hematoxylin-eosin-stained Face-A (Figure 1A) in each of the four animals (Supplementary Table A). We calculated the average number of normal-appearing, degenerated, and dead neurons in each column. The average number of all neurons counted was 8,641.0±256.6 per time point. In the same way, we determined the average number of astrocytes on the periodic acid-fuchsin-Schiff-stained sections. The average number of all astrocytes counted was 663.2±115.7 per time point.
The following criteria were used to classify the neurons. For normal-appearing neurons, a clear cytoplasm containing a large round nucleus with homogenous chromatin and a centrally located large nucleolus was required. For degenerating neurons, an eosinophilic dark or foamy cytoplasm surrounded by a clear halo (swollen APs) along with nuclear chromatin condensation or aggregation was requisite. For dead neurons, either (1) an asterisk-shaped condensed eosinophilic cytoplasm surrounded by a clear halo and a nucleus showing karyorrhexsis or pyknosis or (2) ghost cells with homogeneously, faintly stained eosinophilic cytoplasm occasionally having a faintly stained basophilic nucleus with an obscure nuclear margin met the requirement.
The following criteria were used to identify astrocytes: those cells with a round or elliptical or occasionally polygonal nucleus surrounded by a conspicuous nuclear membrane and having a clear, homogenous chromatin and an eccentrically located single small nucleolus, along with an irregular foamy cytoplasm filled with periodic acid-fuchsin-Schiff-positive glycogen particles.
Area and Number of Mitochondria in the Astrocytic Cytoplasm and End-Feet (Electron Microscopy)
Using a computer-assisted digitizer (Measure-5, System Supply, Nagano Japan), we measured the area (μm2) and the number of mitochondria in the astrocytic cytoplasm in each of three animals at 0, 0.5, 3, 5, 12, and 24 hours after ischemia. These values were expressed as the average with respect to time point, obtained from 26.3±1.7 evenly distributed EM photographs of astrocytes taken at 4,050 to 10,800-fold magnification (Supplementary Table B). Similarly, we used the same animals to measure the area (μm2) of the end-feet and number of mitochondria in them. These data were expressed as the average per time point, obtained from 32.7±2.9 evenly distributed EM pictures of end-feet at the same magnification as used for the astrocytes.
Percent Volume of Astrocytic Processes and Numbers of Cut-Ends of Astrocytic Processes and Mitochondria in them in Neuropils (Electron Microscopy)
Placing a 0.5 × 0.5 cm2 quadratic lattice on each of 22.4±0.8 evenly distributed EM photographs (magnified × 10,800) of neuropil for three animals in each time group, we determined the percent volume of the APs in the neuropil by using the point-counting method (Weibel, 1963; Supplementary Table C). By this method, we counted the number of intersecting points of the lattice touched by the cut-ends of the APs among an average of 38,595.6±1,421.9 evenly distributed points in the neuropil of the EM pictures in each time group, and converted the counted number to the number per 100 intersecting points of the lattice for each EM picture (percent volume) and expressed them as the average per time point. According to the equation for the relative error for different volumetric proportions, all values had <5% error (Weibel, 1963).
We also measured the numbers of cut-ends of APs and their mitochondria in an average of 36,916.4±1,313.8 evenly distributed areas of 0.25 cm2 in size in the neuropil of the EM pictures in each time group. The counted number was converted to the number per a 25-cm2 area of each EM picture (21.53 μm2, after correcting for magnification by real size) and expressed them as the average per time point.
Ultrastructural appearance of APs
Electron microscopically, APs pervade the neuropil and are recognized by their irregular contours. Some of them form perivascular end-feet that make a complete layer of varying width that is imposed between the nerve fibers and the endothelial cells. In the APs, glial fibrils occur in bundles; and the mitochondria are oriented parallel to the long axis of the APs. Glycogen granules are observed, more frequently in end-feet and APs near the neuronal perikaryon than in other areas. In the smaller processes, the only structures found are ribosomes, glycogen granules, and bundle of fibrils.
Ultrastructural criteria for cut-ends of APs
Structures that contained astrocytic microorganelles (e.g., endoplasmic reticulum, rough-surfaced endoplasmic reticulum, ribosomes, glial fibrils, mitochondria, and glycogen granules) but were negative for components of neurites (e.g., microtubules, neurofilaments, synapses, synaptic vesicles, and spine or thorn with spine apparatus). The APs showed various degrees of swelling.
Number of Obstructed Microvessels (Light Microscopy)
We prepared Toluidine blue-stained 1-μm thick cortical Epon sections along a 2-mm-wide path divided into two adjacent columns of 1 mm width from each of three animals killed at 0, 0.5, 3, 5, 12, and 24 hours after ischemia and trimmed them to contain all cortical layers in each column of 1-mm width. Using an eye-piece micrometer (U-OCMSQ10/10) under 1000-power magnification (oil immersion), we determined the percentage of all obstructed microvessels (<10 μm in diameter) showing microcirculatory obstruction and stasis (Little et al, 1981) among all counted microvessels in each section (Supplementary Table D). The average number of all counted microvessels was 2,532.4±262.8 per time point.
Number of Patent Carbon-Black-Suspension-Perfused Microvessels (Light Microscopy)
Under anesthesia, gerbils were perfused for 30 seconds with 1.0 mL of carbon-black-suspension (Platina-Ink, Tokyo, Japan) through a femoral vein by using a microinfusion pump (KDS100, KD Scientific, MA, USA). Thereafter, each animal was guillotined immediately; and its brain was then removed and fixed in 10% phosphate-buffered formaldehyde for 3 days. Using an eye-piece micrometer (U-OCMSQ10/10) under 400-power magnification, we counted the number of carbon-black-suspension-perfused microvessels (CBSPm) in all six cerebral cortical layers in four columns of Face-A and of -B. This was performed by vertically and medially moving the specimen along a 0.25-mm-wide × 4 path of the cortex starting medially from a point one-half of the distance between the rhinal and interhemispheric fissures on hematoxylin-eosin-stained Face-A (0, 0.5, 3, 5, 8, 12, and 24 hours) and Face-B (3, 5, and 12 hours) for each of the three animals (Figure 1A). We also counted the number of CBSPm in each of the four columns located at the corresponding position of the opposite nonischemic right cerebral hemisphere, and expressed the number of CBSPm in each column of the ischemic left hemisphere as a percentage of the number for the nonischemic right hemisphere per each time point (Supplementary Table E). The average numbers of all CBSPm per each time point of the right hemisphere of Face-A and Face-B were 2,111.3±46.3 and 1,359.0±70.8, respectively.
Statistical Analysis
We analyzed the statistical difference between each time group by using analysis of variance, followed by the Bonferroni–Dunn test. All data in the text and in Figures 2 and 5 were presented as the average±s.e.m., and a statistically significant difference was accepted at P<0.05.
Figure 2.
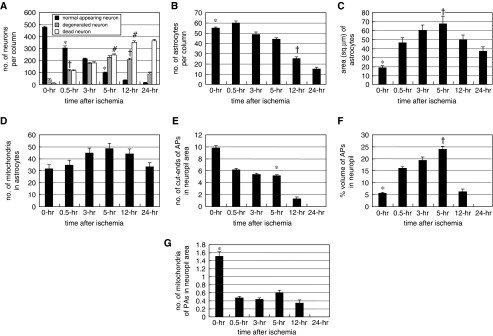
(A) Number of normal-appearing, degenerated, and dead neurons per cortical column of 0.25 mm width. *P<0.05 versus 0, 3, and 12 hours; †P<0.05 versus 0, 3, 5, and 24 hours; #P<0.05 versus 0, 0.5, 12, and 24 hours. (B) Number of astrocytes per cortical column of 0.25 mm in width. *P<0.05 versus 5, 12, and 24 hours; †P<0.05 versus 5, and 24 hours. (C) Astrocytic area (μm2). *P<0.05 versus 0.5, 3, 5, and 12 hours; †P<0.05 versus 12, and 24 hours. (D) Number of mitochondria in astrocytic cytoplasm. No statistically significant differences were found. (E) Number of cut-ends of astrocytic processes (APs) in a neuropil area of 21.33 μm2. *P<0.05 versus 0 and 12 hours. (F) Percent volume of cut-ends of APs in the neuropil area. *P<0.05 versus 0.5, 3, and 5 hours; †P<0.05 versus 12 hours. (G) Number of mitochondria of APs in the neuropil area of 21.33 μm2. *P<0.05 versus 0.5, 3, 5, and 12 hours.
Results
Maturation of Disseminated Selective Neuronal Necrosis (from 0.5 to 5 hours After Last Ischemic Insult)
By LMS observations, DSNN was found to have matured in the cerebral cortex of Face-A (Figure 1A), where degenerating neurons with a halo of swollen APs and dead neurons appeared and increased in number in disseminated manner (DSNN) among the normal-appearing neurons at 0.5 (Figure 1B) and 5 hours after ischemia (Figure 1C). These changes were more intense in laminar manner in the third, fifth, and sixth cortical layers. On morphometry by LMS, normal-appearing neurons decreased, whereas degenerated and dead neurons increased, in number (Figure 2A). Astrocytes slightly decreased in number from 55.3±0.92 at 0 hours to 43.9±1.76 per column at 5 hours (Figure 2B), but there were no statistical differences among 0-, 0.5-, and 3-hour values.
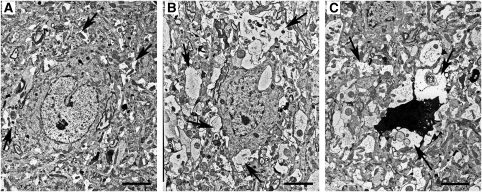
At 3 hours after ischemia, we compared APs in EM pictures taken around the normal-appearing, degenerated, and dead neurons. No necrotic hallmarks were observed in the slightly darkened degenerated neurons with slight condensations of nuclear chromatin. Some of these neurons may have later recovered during the maturation period (Figure 3B). Dead neurons appeared as variously condensed dark cell bodies with necrotic hallmarks such as flocculent densities in mitochondria, disruption of the nuclear and/or cellular membrane, and advanced nuclear chromatin condensates or karyorrhexis (Figure 3C). In these areas, where DSNN was maturing in the cerebral cortex of Face-A, swelling and degeneration of the APs in the neuropil were more advanced in that order around the normal-appearing (Figure 3A), degenerated (Figure 3B), and dead neurons (Figure 3C) at an even earlier stage, that is at 3 hours after ischemia, than at 12 hours in the cerebral cortical RPI or penumbra in Face-B (Ito et al, 2009).
Figure 3.
Electron microscopic findings on three kinds of neurons in the second to fifth cortical layers of Face-A (bars=2.4 μm), at 3 hours after ischemia. (A) Normal-appearing neuron with slightly swollen astrocytic processes (APs) (arrows). (B) Degenerated neuron with advanced swelling of APs, especially around the neuron (arrows). (C) Dead neuron surrounded by remarkably swollen degenerated APs (arrows).
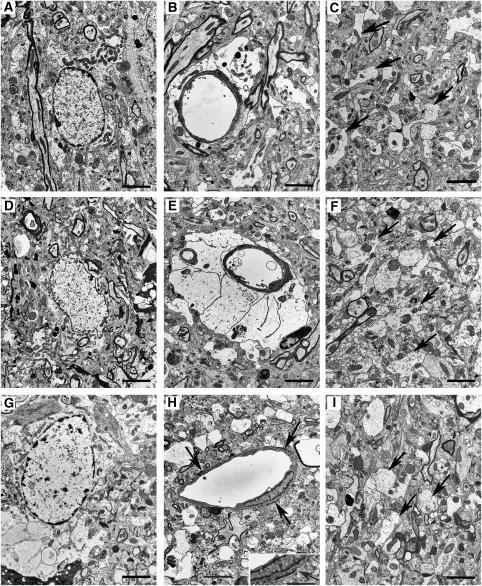
In EM photos, the astrocytic cytoplasm was swollen at 0.5 (Figure 4A) and 5 hours (Figure 4D) and the area of the astrocytes increased (Figure 2C). However, there were no statistically significant differences in the number of their mitochondria among all time courses examined (Figure 2D). The cut-ends of APs in the neuropil at 0.5 hour (Figure 4C) and 5 hours (Figure 4F) decreased in number from 9.79±0.48 at 0 hour to 5.16±0.19/21.53 μm2 at 5 hours. However, there were no statistical differences among 0.5-, 3-, and 5-hour values (Figure 2E). However, the APs increased in percent volume from 5.62%±0.45% at 0 hour to 24.15%±1.2% at 5 hours (Figure 2F), and the density of their glycogen granules also increased (Figure 4F). In contrast, their mitochondrial number decreased (Figure 2G), associated with a decrease in the number of their cut-ends (Figure 2E).
Figure 4.
Electron microscopic findings on the second to fifth cortical layers of Face-A (bars=2.4 μm). (A–C) Obtained at 0.5 hours after ischemia. (A) Swollen astrocytic cytoplasm. (B) Slightly swollen end-feet. (C) Decreased number of astrocytic processes (APs) and their mitochondria in the neuropil (arrows). (D) At 5 hours after ischemia, swollen astrocytic cytoplasm is noted. (E) At 3 hours after ischemia, remarkably swollen end-feet are present. (F) At 5 hours after ischemia, swollen APs are evident in the neuropil (arrows). (G) At 24 hours after ischemia, swollen degenerative astrocytic cytoplasm with condensed nuclear chromatin is noted. (H) At 24 hours after ischemia, necrotic end-feet (arrows) are evident. (Inset) Magnified necrotic end-foot (arrow; bar=1.5 μm). (I) At 12 hours after ischemia, a remarkably decreased number of swollen APs (arrows) are found in the neuropil.
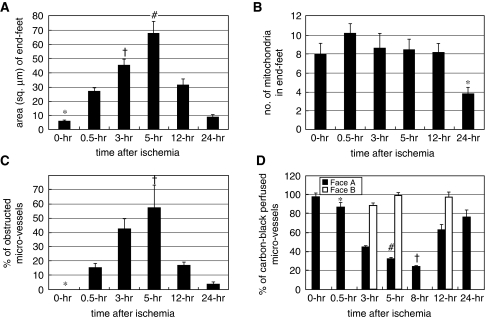
In EM pictures, the end-feet also showed increased swelling at 0.5 hour (Figure 4B) and at 3 hours (Figure 4E); and the area of the end-feet increased markedly from 6.01±0.64 at 0 hour to 67.83±8.11 μm2 at 5 hours (Figure 5A). The number of mitochondria in the end-feet decreased at 24 hours; however, there were no statistical differences among the values at the other time periods (Figure 5B).
Figure 5.
(A) Area of end-feet (μm2). *P<0.05 versus 0.5, 3, 5, and 12 hours; †P<0.05 versus 5, and 24 hours; #P<0.05 versus 12, and 24 hours. (B) Number of mitochondria in end-feet. *P<0.05 versus 0.5, 3, 5, and 12 hours. (C) Percentage of obstructed microvessels among all counted microvessels. *P<0.05 versus 3, 5, and 12 hours; †P<0.05 versus 0.5, 12, and 24 hours. (D) Percentage ratio of carbon-black-suspension-perfused microvessels (CBSPm) in the left ischemic hemisphere to all CBSPm in the corresponding position of the opposite (right) nonischemic hemisphere. *P<0.05 versus 3, 5, 8, and 12 hours; †P<0.05 versus 0, 0.5, 3, 5, 12, and 24 hours. #P<0.05 versus 0, 12, and 24 hours.
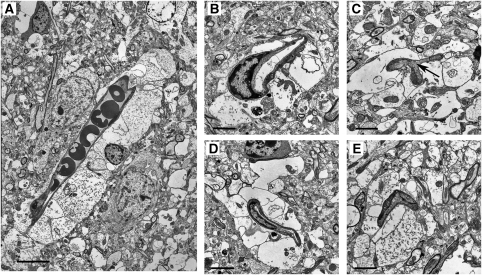
Obstructed microvessels with stasis were observed at 5 hours in LMS (Figures 1C and 1G). They increased in percentage from 0% at 0 hour to 57.3%±16.1% at 5 hours (Figure 5C), whereas the CBSPm in Face-A (Figure 1F) decreased in number from 97.5%±4.16% at 0 hour to 31.9%±1.85% at 5 hours; and further decreased to 23.8%±0.69% at 8 hours after ischemia (Figure 5D). The EM revealed obstructed microvessels of various shapes that had been compressed by swollen end-feet and had developed microvascular stasis (Figure 6).
Figure 6.
Electron microscopic findings of narrowed and obstructed microvessels resulting from compression by swollen end-feet, at 5 hours after ischemia. (A) Obstructed microvessel with evidence of stasis is seen. (bar=7.5 μm). (B) This microvascular lumen is remarkably deformed (bar=2.4 μm). (C) A narrowed microvascular lumen showing stasis (arrow) is seen. (bar=1.8 μm). (D) This microvascular lumen is remarkably narrowed (bar=3.0 μm). (E) A completely obstructed microvascular lumen is shown (bar=2.1 μm).
In Face-B where only DSNN matured without evolution of an infarction, no significant reduction in the number of CBSPm was observed during 3 to 12 hours after the final insult (Figure 5D).
Evolution of Focal Infarction (at 12 and 24 hours After Ischemia)
At 12 hours after ischemia, flocks of foamy necrotic foci were scattered in the cerebral cortex; and many microvessels became patent (Figure 1D). The cut-ends of APs had degenerated (Figure 4I) and become decreased in number to 1.29±0.31 (Figure 2E). The numbers of degenerated and normal-looking neurons decreased, whereas those of dead neurons increased drastically (Figure 2A). The numbers of astrocytes also markedly decreased to 25.25±1.88 (Figure 2B).
By 24 hours, the numbers of normal-appearing and degenerated neurons were greatly reduced (Figure 2A); and dead neurons were observed throughout the diffusely spongy necrotic tissue, and almost all microvessels had become patent (Figure 1E; see temporal profiles of results in Supplementary Table F). The number of astrocytes further decreased to 15.25±1.65 (Figure 2B), and almost all of the astrocytes had disintegrated. The remaining ones were swollen remarkably with degenerated cytoplasm (Figure 4G), and the cut-ends of APs had disappeared from the necrotic tissue (Figure 2E). In accordance with this drastic disintegration of astrocytes, their remaining end-feet had thinned out to 8.92±1.67 μm2, (Figure 5A) and/or had become necrotic (Figure 4H); and then the vascular compression disappeared (Figure 1E). Therefore, obstructed microvessels decreased to 3.6%±1.3% (Figure 5C); and that of CBSPm increased to 76.2%±7.11% (Figure 5D). However, pan-necrosis was already complete.
At 72 hours after ischemia, a sharply demarcated focal infarction became more prominent and was surrounded by the RPI or penumbra, where DSNN matured in both Face-A and -B (Figure 1A) (see Supplementary Table F: temporal profiles of evolution of infarction in maturing DSNN).
Discussion
In this study in Face-A, during 0.5 and 5 hours after ischemia, degenerated and dead neurons increased in number in a disseminated manner (DSNN) associated with heterogeneously impaired interaction between neurons and degenerating APs, as in the case of the maturing DSNN in the earlier study on Face-B (Ito et al, 2009). As no necrotic hallmarks were observed in the slightly darkened degenerated neurons with slight nuclear chromatin condensations, some of these neurons may have later recovered during the maturation period in the DSNN. But, by 12 and 24 hours after ischemia, the numbers of normal-appearing and degenerated neurons decreased; and the dead neurons increased in number drastically. The remaining astrocytes degenerated, and their APs completely disappeared around 24 hours, associated with tissue necrosis, that is, focal infarction. Different from the earlier study in the Face-B where the astrocytic density was constant during DSNN maturation, the ischemic insult in the Face-A induced injury of astrocytic function, resulting in a slight decrease in the number of astrocytes and marked swelling of the astrocytic end-feet from 0.5 to 5 hours in the maturing DSNN. That swelling induced compression of microvessels and decreased microvascular perfusion, which induced sharply circumscribed tissue necrosis surrounded by RPI where only DSNN progressed (Figure 1A; Face-A).
In our earlier study on energy metabolism using the same experimental model, we found an abrupt drop in ATP content, reduced SDH activity, and a drop in pH around 12 hours after ischemia in the cerebral cortex corresponding to the sharply circumscribed focal infarction in the Face-A. However, the cause of these drops has remained unknown. On the other hand, in the cerebral cortex of RPI where only maturation of DSNN occurred in the Face-B, energy metabolism showed only slight changes over the periods during which circulation was restored (Kuroiwa et al, 2000).
In an earlier study, we performed unilateral carotid occlusion, and 30 minutes later investigated the no-reflow phenomenon immediately after recirculation by perfusion of the animals with a carbon-black-suspension and by performing C14-antipyrine radio-autography. In this ischemic model where the cerebral blood flow (CBF) did not cease completely, but was reduced during ischemia, we found that the no-reflow phenomenon was transient; it continued for <0.5 minutes after recanalization, and the regional CBF (rCBF) returned to normal (Ito et al, 1980).
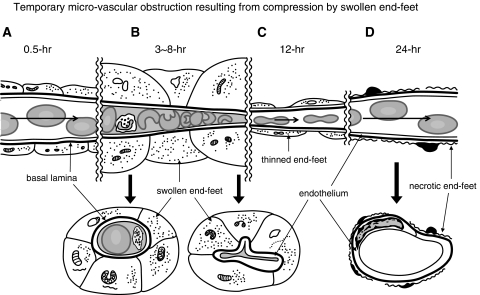
In this study, we found that a focal cerebral cortical infarction evolved in the maturing DSNN. It was being induced by delayed occurrence of temporary microvascular obstruction because of compression of microvessels by swollen end-feet at 3 to 8 hours after the insult, and it later resulted in tissue pan-necrosis at 12 to 24 hours after ischemia (Figures 1A and 7; Supplementary Table F). In primates, the rate of rCBF in control animals is 50 mL per 100 g per minute; and when it is <18 mL per 100 g per minute, an infarction evolves, occurring with a delay of <3 to 4 hours along a rising sigmoid function between rCBF and the duration before the appearance of an infarction (Jones et al, 1981). Although the rCBF in the cerebral cortex of conscious gerbils is 110 mL per 100 g per minute (Ohno et al, 1984), the ratio of the normal blood flow to the blood flow at the threshold necessary to induce infarction remains roughly constant across species at 3:1 (Auer and Sutherland, 2002). In this study, the percentage of microvessels perfused by the carbon-black-suspension was reduced to 32% and 24% of the total perfused microvessels at 5 and 8 hours after ischemia, respectively. Thus, the rCBF in primates can be calculated simply as reduced to 16 and 12 mL per 100 g per minute, respectively. On the basis of the rising sigmoid function observed in primates, infarction evolved, occurring with a delay of about 3 to 4 hours after the microvascular obstruction. As vascular compression by swollen end-feet became less severe because of the rapid reduction in the number of astrocytes and swelling of their end-feet caused by their necrosis, the patency of the obstructed microvessels eventually recovered at ∼12 to 24 hours after ischemia. However, pan-necrosis had already completed (Figure 7; Supplementary Table F).
Figure 7.
Illustration of temporary microvascular obstruction resulting from compression by swollen end-feet. (A) At 0.5 hour after ischemia, no microvascular obstruction is observed. (B) By 3 to 8 hours after ischemia, swollen end-feet compressed the microvessels and induced microvascular obstruction as evidenced by stasis. (C) By 12 hours after ischemia, there is a decrease in the number and thickness of end-feet, resulting in restoration of blood flow in the microvessels. (D) At 24 hours after ischemia, astrocytes and end-feet have become necrotic; and microvascular compression has disappeared. Upper: longitudinal scheme along microvessels. Lower: transverse section of microvessels. Long arrows: bloodstream.
The following reports were found in the past literature: during permanent MCA occlusion, microvascular obstruction and stasis induce further development of pan-necrosis during MCA occlusion (Crowell and Olsson, 1972; Little et al, 1981; Garcia et al, 1994). After temporary MCA occlusion, secondary occlusion of microvessels by polymorphonuclear leukocytes demonstrates a role of these cells in early microvascular injuries and the no-reflow phenomenon (del Zoppo et al, 1991). In this study, an occasional mixture of polymorphs and platelets was observed among the erythrocytes in the microvessels where stasis had occurred. However, neither microthrombi nor microvascular obstruction by polymorphs was observed.
Swelling of end-feet and temporary compressive obstruction of microvessels may occur in the early phase after reopening of an obstructed major vessel (e.g., after tissue plasminogen activator (tPA) administration). Therefore, before evolution of an infarction, strategies to prevent swelling of end-feet should commence soon after stroke onset, before or immediately after the reopening of the obstructed major vessels but before infarction evolution. Osmotherapy using low-molecular-weight dextran (Crowell and Olsson, 1972), mannitol (Little, 1978), or glycerol (Meyer et al, 1972), as well as high colloid-oncotic pressure therapy (Hakamata et al, 1995), might be effective. Aquaporin 4, a member of the family of membrane water channels, is present as orthogonal arrays in the cell surface of the end-feet in contact with microvessels (Berry et al, 2002), and pharmacological manipulations of AQP-4 and -9 expression may offer a therapeutic strategy (Lo et al, 2005; Badaut et al, 2007). In conclusion, during DSNN maturation in the cerebral cortex, focal infarction did not develop continuously from DSNN. Instead, it evolved by secondary microvascular obstruction and stasis resulting from compression by the swollen astrocytic end-feet.
Glossary
- APs
astrocytic processes
- CBSPm
carbon-black-suspension-perfused microvessels
- cut-ends of APs
astrocytic processes appearing in cross-section on the EM photos
- DSNN
disseminated selective neuronal necrosis or selective neuronal necrosis (selectively only neurons die not as a mass but in a disseminated manner among the surviving neurons)
- EM
electron microscopy
- Face-A
coronal-cut surface at the chaismatic level of the gerbil brain
- Face-B
coronal-cut surface at infundibular level of the gerbil brain
- HE
hematoxylin-eosin
- IF
interhemispheric fissure of the gerbil brain
- LMS
light microscopy
- PAS
periodic acid-fuchsin-Schiff
- rCBF
regional cerebral blood flow
- RF
rhinal fissure of the gerbil brain
- RPI
region peripheral to infarction of the gerbil brain
- SDH
succinic dehydrogenase
- TB
Toluidine blue
The authors declare no conflict of interest.
Footnotes
Supplementary Information accompanies the paper on the Journal of Cerebral Blood Flow & Metabolism website (http://www.nature.com/jcbfm)
This work was supported in part by grants from the Yumin Memorial Grant (to KO).
Supplementary Material
References
- Auer R, Sutherland G.2002Hypoxia and related conditions Greenfield's neuropathology(Graham D, Lantos P, eds), 7th ed. Vol. 1.London, New York, New Delhi: Arnold; 233–280. [Google Scholar]
- Badaut J, Ashwal S, Tone B, Regli L, Tian HR, Obenaus A. Temporal and regional evolution of aquaporin-4 expression and magnetic resonance imaging in a rat pup model of neonatal stroke. Pediatr Res. 2007;62:248–254. doi: 10.1203/PDR.0b013e3180db291b. [DOI] [PubMed] [Google Scholar]
- Bambrick L, Kristian T, Fiskum G. Astrocyte mitochondrial mechanisms of ischemic brain injury and neuroprotection. Neurochem Res. 2004;29:601–608. doi: 10.1023/b:nere.0000014830.06376.e6. [DOI] [PubMed] [Google Scholar]
- Berry M, Butt A, Wilkins G, Perry V.2002Structure and function of glia in the central nervous system Greenfield's neuropathology(Graham D, Lantos P, eds), 7th ed. Vol. 1.London, New York, New Delhi: Arnold; 75–121. [Google Scholar]
- Chen Y, Swanson RA. Astrocytes and brain injury. J Cereb Blood Flow Metab. 2003;23:137–149. doi: 10.1097/01.WCB.0000044631.80210.3C. [DOI] [PubMed] [Google Scholar]
- Crowell RM, Olsson Y. Impaired microvascular filling after focal cerebral ischemia in the monkey. Modification by treatment. Neurology. 1972;22:500–504. doi: 10.1212/wnl.22.5.500. [DOI] [PubMed] [Google Scholar]
- DeGirolami U, Crowell RM, Marcoux FW. Selective necrosis and total necrosis in focal cerebral ischemia. Neuropathologic observations on experimental middle cerebral artery occlusion in the macaque monkey. J Neuropathol Exp Neurol. 1984;43:57–71. doi: 10.1097/00005072-198401000-00005. [DOI] [PubMed] [Google Scholar]
- del Zoppo GJ, Schmid-Schonbein GW, Mori E, Copeland BR, Chang CM. Polymorphonuclear leukocytes occlude capillaries following middle cerebral artery occlusion and reperfusion in baboons. Stroke. 1991;22:1276–1283. doi: 10.1161/01.str.22.10.1276. [DOI] [PubMed] [Google Scholar]
- Garcia JH, Liu KF, Yoshida Y, Chen S, Lian J. Brain microvessels: factors altering their patency after the occlusion of a middle cerebral artery (Wistar rat) Am J Pathol. 1994;145:728–740. [PMC free article] [PubMed] [Google Scholar]
- Hakamata Y, Ito U, Hanyu S, Yoshida M. Long-term high-colloid oncotic therapy for ischemic brain edema in gerbils. Stroke. 1995;26:2149–2153. doi: 10.1161/01.str.26.11.2149. [DOI] [PubMed] [Google Scholar]
- Hanyu S, Ito U, Hakamata Y, Nakano I. Topographical analysis of cortical neuronal loss associated with disseminated selective neuronal necrosis and infarction after repeated ischemia. Brain Res. 1997;29:154–157. doi: 10.1016/s0006-8993(97)00726-9. [DOI] [PubMed] [Google Scholar]
- Hanyu S, Ito U, Hakamata Y, Yoshida M. Transition from ischemic neuronal necrosis to infarction in repeated ischemia. Brain Res. 1995;686:44–48. doi: 10.1016/0006-8993(95)00449-z. [DOI] [PubMed] [Google Scholar]
- Ito U, Hakamata Y, Kawakami E, Oyanagi K. Degeneration of astrocytic processes and their mitochondria in cerebral cortical regions peripheral to the cortical infarction: heterogeneity of their disintegration is closely associated with disseminated selective neuronal necrosis and maturation of injury. Stroke. 2009;40:2173–2181. doi: 10.1161/STROKEAHA.108.534990. [DOI] [PubMed] [Google Scholar]
- Ito U, Ohno K, Nakamura R, Suganuma F, Inaba Y. Brain edema during ischemia and after restoration of blood flow. Measurement of water, sodium, potassium content and plasma protein permeability. Stroke. 1979;10:542–547. doi: 10.1161/01.str.10.5.542. [DOI] [PubMed] [Google Scholar]
- Ito U, Ohno K, Yamaguchi T, Tomita H, Inaba Y, Kashima M. Transitional appearance of ‘no-reflow' phenomenon in Mongolian gerbils. Stroke. 1980;11:517–521. doi: 10.1161/01.str.11.5.517. [DOI] [PubMed] [Google Scholar]
- Ito U, Spatz M, Walker J, Jr, Klatzo I. Experimental cerebral ischemia in mongolian gerbils. I. Light microscopic observations. Acta Neuropathol Berl. 1975;32:209–223. doi: 10.1007/BF00696570. [DOI] [PubMed] [Google Scholar]
- Jones TH, Morawetz RB, Crowell RM, Marcoux FW, FitzGibbon SJ, DeGirolami U, Ojemann RG. Thresholds of focal cerebral ischemia in awake monkeys. J Neurosurg. 1981;54:773–782. doi: 10.3171/jns.1981.54.6.0773. [DOI] [PubMed] [Google Scholar]
- Kirino T. Delayed neuronal death in the gerbil hippocampus following ischemia. Brain Res. 1982;239:57–69. doi: 10.1016/0006-8993(82)90833-2. [DOI] [PubMed] [Google Scholar]
- Kuroiwa T, Mies G, Hermann D, Hakamata Y, Hanyu S, Ito U. Regional differences in the rate of energy impairment after threshold level ischemia for induction of cerebral infarction in gerbils. Acta Nueropathol. 2000;100:587–594. doi: 10.1007/s004010000235. [DOI] [PubMed] [Google Scholar]
- Little JR. Modification of acute focal ischemia by treatment with mannitol. Stroke. 1978;9:4–9. doi: 10.1161/01.str.9.1.4. [DOI] [PubMed] [Google Scholar]
- Little JR, Cook A, Cook SA, MacIntyre WJ. Microcirculatory obstruction in focal cerebral ischemia: albumin and erythrocyte transit. Stroke. 1981;12:218–293. doi: 10.1161/01.str.12.2.218. [DOI] [PubMed] [Google Scholar]
- Lo AC, Chen AY, Hung VK, Yaw LP, Fung MK, Ho MC, Tsang MC, Chung SS, Chung SK. Endothelin-1 overexpression leads to further water accumulation and brain edema after middle cerebral artery occlusion via aquaporin 4 expression in astrocytic end-feet. J Cereb Blood Flow Metab. 2005;25:998–1011. doi: 10.1038/sj.jcbfm.9600108. [DOI] [PubMed] [Google Scholar]
- Marcoux FW, Morawetz RB, Crowell RM, DeGirolami U, Halsey JH., Jr Differential regional vulnerability in transient focal cerebral ischemia. Stroke. 1982;13:339–346. doi: 10.1161/01.str.13.3.339. [DOI] [PubMed] [Google Scholar]
- Meyer JS, Fukuuchi Y, Shimazu K, Ouchi T, Ericsson AD. Effect of intravenous infusion of glycerol on hemispheric blood flow and metabolism in patients with acute cerebral infarction. Stroke. 1972;3:168–180. doi: 10.1161/01.str.3.2.168. [DOI] [PubMed] [Google Scholar]
- Ohno K, Ito U, Inaba Y. Regional cerebral blood flow and stroke index after left carotid artery ligation in the conscious gerbil. Brain Res. 1984;297:151–157. doi: 10.1016/0006-8993(84)90552-3. [DOI] [PubMed] [Google Scholar]
- Smith ML, Auer RN, Siesjo BK. The density and distribution of ischemic brain injury in the rat following 2-10 min of forebrain ischemia. Acta Neuropathol. 1984;64:319–332. doi: 10.1007/BF00690397. [DOI] [PubMed] [Google Scholar]
- Swanson RA, Farrell K, Stein BA. Astrocyte energetics, function, and death under conditions of incomplete ischemia: a mechanism of glial death in the penumbra. Glia. 1997;21:142–153. doi: 10.1002/(sici)1098-1136(199709)21:1<142::aid-glia16>3.0.co;2-s. [DOI] [PubMed] [Google Scholar]
- Weibel E. Morphometry of the human lung. Berlin, Gowttingen, Heidelberg: Springer-Verlag; 1963. [Google Scholar]
- Weinstein PR, Anderson GG, Telles DA. Neurological deficit and cerebral infarction after temporary middle cerebral artery occlusion in unanesthetized cats. Stroke. 1984;17:318–324. doi: 10.1161/01.str.17.2.318. [DOI] [PubMed] [Google Scholar]
Associated Data
This section collects any data citations, data availability statements, or supplementary materials included in this article.


