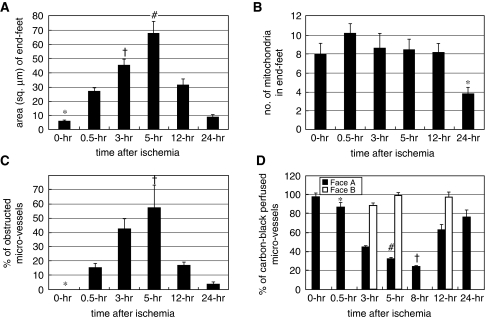
Figure 5.
(A) Area of end-feet (μm2). *P<0.05 versus 0.5, 3, 5, and 12 hours; †P<0.05 versus 5, and 24 hours; #P<0.05 versus 12, and 24 hours. (B) Number of mitochondria in end-feet. *P<0.05 versus 0.5, 3, 5, and 12 hours. (C) Percentage of obstructed microvessels among all counted microvessels. *P<0.05 versus 3, 5, and 12 hours; †P<0.05 versus 0.5, 12, and 24 hours. (D) Percentage ratio of carbon-black-suspension-perfused microvessels (CBSPm) in the left ischemic hemisphere to all CBSPm in the corresponding position of the opposite (right) nonischemic hemisphere. *P<0.05 versus 3, 5, 8, and 12 hours; †P<0.05 versus 0, 0.5, 3, 5, 12, and 24 hours. #P<0.05 versus 0, 12, and 24 hours.

