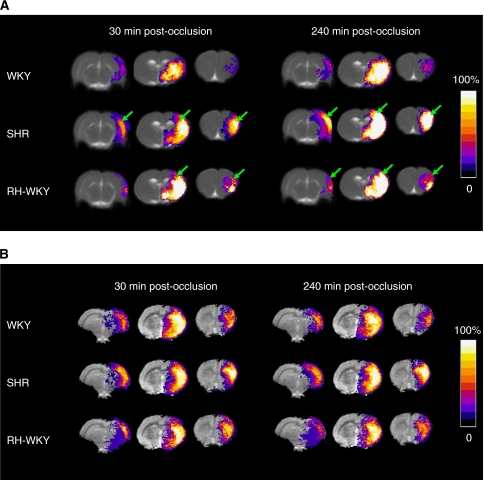
Figure 3.
(A) Apparent diffusion coefficient (ADC)-defined lesions represented as incidence maps in WKY (n=9), SHR (n=11), and RH-WKY (n=7) at 30 and 240 minutes after occlusion. At all times, lesions are larger in hypertensive than in normotensive rats involving an extended zone of the cortex and being more widespread in an antero-posterior direction (indicated by arrows). The ADC-defined lesions expand along time in the three groups. (B) Hypoperfusion represented as incidence maps at 30 and 240 minutes after occlusion. The color representations are shown according to the scale depicted on the right, in which black is without a lesion in any animal and white is where 100% of the animals displayed an abnormal signal. RH-WKY, renovascular-hypertensive WKY; SHR, spontaneously hypertensive rats; WKY, normotensive Wistar-Kyoto.

