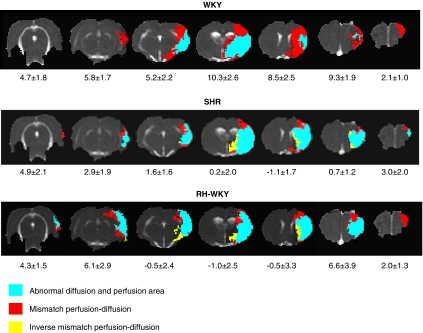
Figure 5.
Representative perfusion–diffusion mismatch in a WKY, SHR, and RH-WKY rat at 90 minutes after occlusion. The blue color indicates abnormal diffusion area, whereas the red color indicates the ischemic penumbra as defined by perfusion–diffusion mismatch. The yellow color indicates the inverse mismatch corresponding to an area with reduced apparent diffusion coefficient (ADC) but normal perfusion. The mean area of the mismatch per group is indicated under each slice (mm2). RH-WKY, renovascular-hypertensive WKY; SHR, spontaneously hypertensive rats; WKY, normotensive Wistar-Kyoto.

