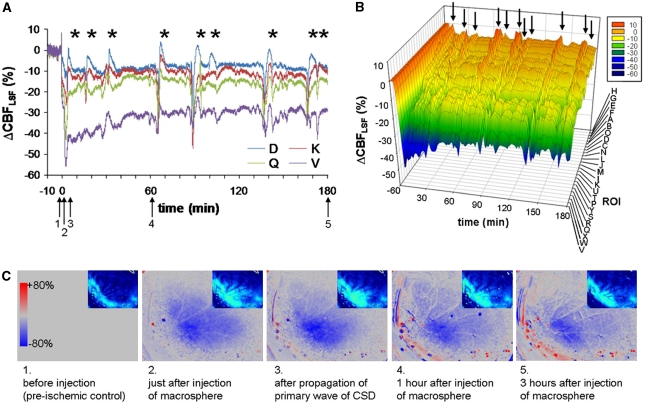
Figure 2.
Individual case of CBFLSF changes in individual regions of interest (ROIs) after macrosphere injection. (A) Line plots of ΔCBFLSF in selected ROIs. Asterisks indicate CBFLSF waves coupled to cortical spreading depolarizations (CSDs). (B) The 3D chart of ΔCBFLSF of all ROIs of the individual animal arranged in order of the initial CBF decrease immediately after middle cerebral artery occlusion (MCAO) before appearance of CBFLSF waves. (C) Speckle contrast images taken at the time points indicated in Figure 2A by black arrows. In these red and blue images, red signifies hyperemia and blue signifies hypoaemia compared with a baseline image (preinjection image).

