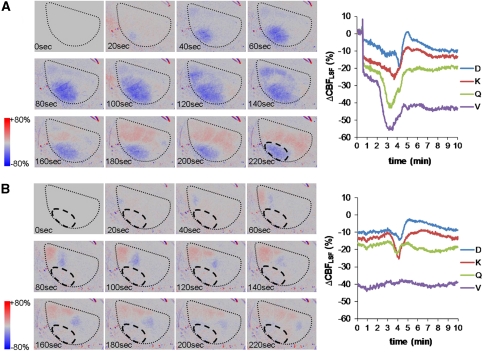
Figure 4.
Examples of sequential speckle contrast images of primary concentric and secondary circumferential CBFLSF waves and corresponding line plots of selected region of interest (ROI) analyses. The black dotted line shows the outline of the field of view. The image before initiation of waves (0 second) was chosen as the baseline image. Color coding illustrates increases (red) and decreases of CBFLSF (blue) relative to the baseline image. (A) Typical primary CBFLSF wave originating from the lateral edge of the field of view (most ischemic transformation) and propagated concentrically into the periphery of the ischemic territory. The black dashed line in the last image indicates the ischemic lesion remaining after this first wave. The line plot on the right illustrates that in core regions (ROI V, Q), CBFLSF responses to cortical spreading depolarization (CSD) are hypoemic, with additional reduction seen in the most central region (ROI V), whereas regions in the surrounding of the ischemic core are biphasic, with a pronounced hyperemic portion of the response. (B) Secondary CBFLSF wave with hypoemic (blue) wave front and a hyperemic (red) wave tail propagating circumferentially along the core of the ischemic territory (black dashed line).

