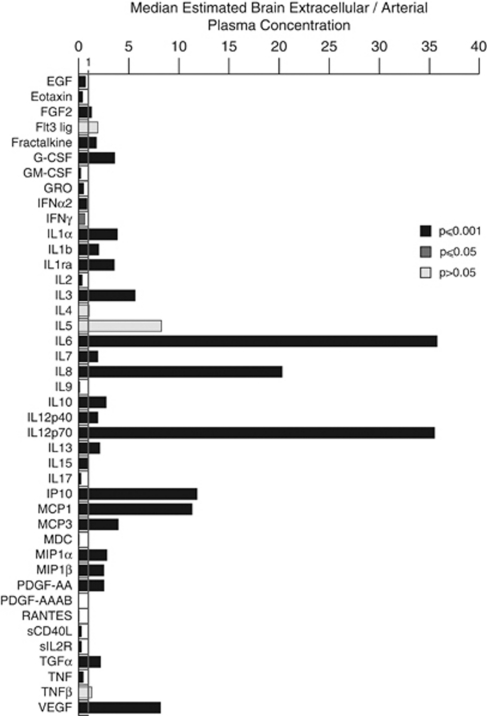
Figure 4.
Estimated brain extracellular/plasma arterial concentration. The histogram illustrates the median ratio of estimated brain extracellular concentration (calculated from 3.5% HAS-perfused catheter values and RR values in Table 3) divided by the paired plasma arterial concentration. The paired samples were used to calculate the ratio at each time point, and the median of these values plotted. A ratio >1 indicates that the estimated brain extracellular concentration is higher than the arterial plasma concentration. A Wilcoxon signed rank two-tailed test was used to compare the cytokine concentrations in brain extracellular space and arterial plasma. The dark coloured bars indicate the cytokines that had a statistically significant difference between the two perfusates (grey bars P⩽0.05, black bars P⩽0.001). EGF, epidermal growth factor; G-CSF, granulocyte colony-stimulating factor; GM-CSF, granulocyte macrophage colony-stimulating factor; IFN, interferon; IL, interleukin; RR, relative recovery; TGF, transforming growth factor; TNF, tumour necrosis factor; VEGF, vascular endothelial growth factor; HAS, human albumin solution.

