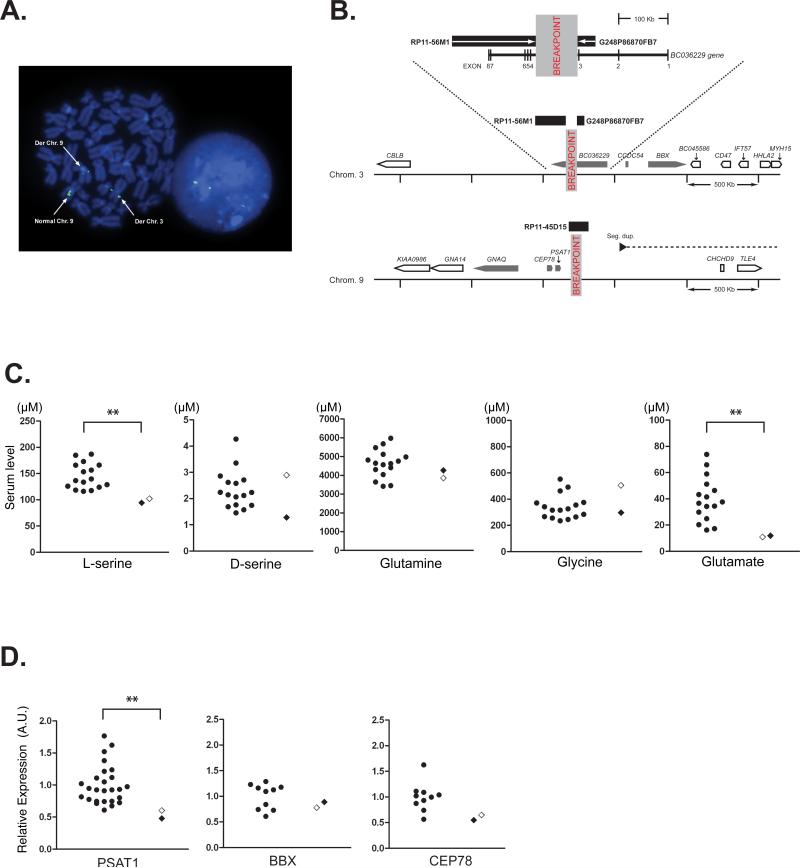
Figure 1.
Chromosomal translocation and molecular profiles of the proband and her son. A) Fluorescent in situ hybridization positions the chromosome 9q21.2 breakpoint. A metaphase spread (left) and interphase nucleus (right) stained with 4',6-diamidino-2-phenylindole (DAPI) (blue). A green fluorescently labeled probe generated from RP11-45D15 BAC clone DNA is shown hybridized to the normal chromosome 9 and derived chromosomes 3 and 9 on a metaphase spread (left) stained blue with DAPI. This triple signal, also seen in an interphase nucleus (right), indicates that the DNA probe sequence spans the breakpoint. The relative proportions of signals on the two derived chromosomes suggest that the breakpoint is located towards the centromeric end of the DNA probe sequence. B) Schematic representation of the two breakpoint loci. The BAC and fosmid clones flanking the chromosome 3 breakpoint within the BC036229 transcript are shown as black rectangles. The magnified genomic context of the disruption is shown below including the location and orientation of nearby genes (nearest genes, grey block arrows: other genes, white block arrows). The chromosome 9 breakpoint does not directly disrupt a gene but is located close to PSAT1. The proximity to a segmental duplication pair (the black arrow indicates the centromeric component and the dashed line indicates the direction of the telomeric component ~1.8 Mb downstream) may indicate potential chromosome instability in this region. C) Serum level of L-serine, D-serine, and other relevant amino acids determined by HPLC. *p=0.013, Mann-Whitney U-test. Control, n=16. The open diamond indicates the proband. D) mRNA expression of the genes that are adjacent to the breakpoints. Expression level was determined by quantitative real-time RT-PCR and presented as expression relative to GAPDH mRNA. PSAT1 mRNA expression level was decreased significantly in the subjects (proband and her son) (**p=0.0053, Mann-Whitney U-test). No significant difference was observed for bobby sox homolog (Drosophila) (BBX) and centrosomal protein 78 kDa (CEP78) mRNA expression. Control: n=26 for PSAT1, n=10 for BBX and CEP78. The open diamond indicates the proband. mRNA expression of coiled-coil domain containing 54 (CCDC54), guanine nucleotide binding protein q polypeptide (GNAQ), and BC036229 was not detected in either subject or control lymphoblastoid cells. See Figure 1B for the location of each gene.

