
Figure 3.
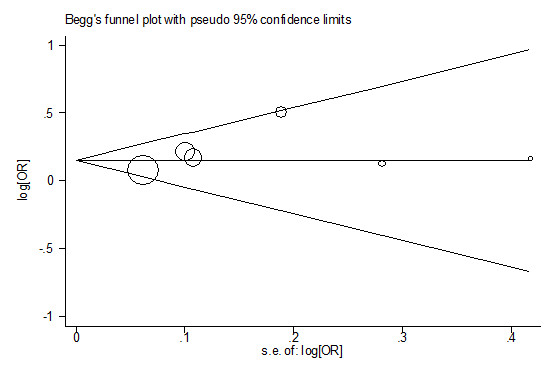
Begg's funnel plot for publication bias test. Each point represents a separate study for the indicated association. Log[OR], natural logarithm of OR. Horizontal line, mean effect size.
Official websites use .gov
A
.gov website belongs to an official
government organization in the United States.
Secure .gov websites use HTTPS
A lock (
) or https:// means you've safely
connected to the .gov website. Share sensitive
information only on official, secure websites.
Begg's funnel plot for publication bias test. Each point represents a separate study for the indicated association. Log[OR], natural logarithm of OR. Horizontal line, mean effect size.