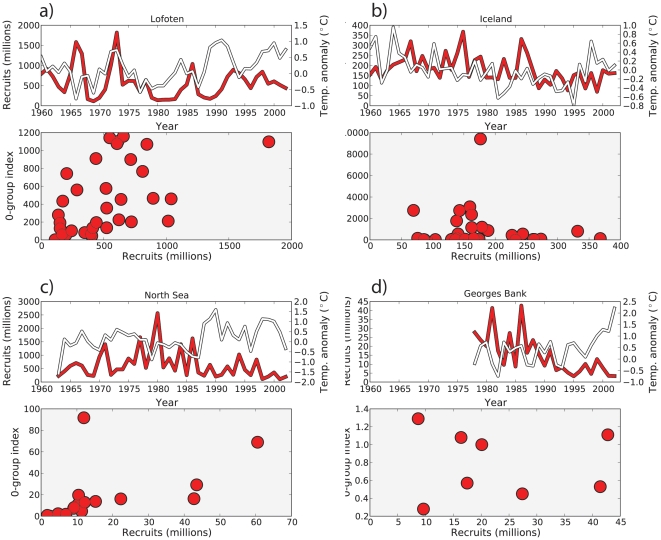
Figure 5. The relationship between number of recruits (millions), temperature anomalies, and 0-group index (index for number of juveniles).
Upper panel shows number of recruits (red line, left axis) and temperature anomalies (white, right axis) as a function of year for a) Lofoten, b) Iceland, c) North Sea, and d) Georges Bank respectively. The lower panel shows a scatter plot of the number of recruits versus 0-group index (5–6 months old).

