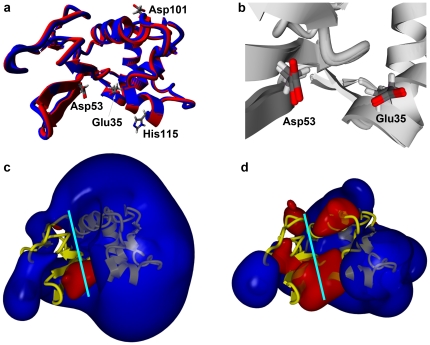
Figure 3. Structural Comparison of Double Mutant and Wild Type hLYS.
(a) Overlaid ribbon diagrams of the peptide backbones; wild type hLYS in blue (PDB file 1JWR) [32] and charge engineered double mutant in red (PDB file 3LN2). The catalytic residues (35 and 53) and the two mutated residues of 3LN2 (101 and 115) are shown as stick models with: Carbon-grey; Hydrogen-white; Nitrogen-blue; Oxygen-red. The structural alignment yielded a low root-mean-squared (RMS) deviation of 0.42 Å for the backbone atoms and 1.17 Å overall. (b) Detailed view of the active site indicating negligible differences in the position of the catalytic residues Glu35 and Asp53. (c) The electrostatic potential field of wild type hLYS contoured as a 110 kJ/mol surface. Calculation performed with the AMBER99 force field in an 83×70×77 Å simulation cell with periodic boundaries. Positive potential is colored dark blue and negative potential red. The peptide backbone is rendered as a yellow ribbon, and the substrate binding cleft is indicated with a light blue line. The field is overwhelmingly positive in nature with negative potential localized predominantly near the catalytic residues Glu35 and Asp53. (d) The analogous electrostatic potential field of the double mutant contoured at 110 kJ/mol. The global electrostatic field is contracted relative to the wild type protein, as seen by the reduced size of the 110 kJ/mol surface. Additionally, the potential of the active site cleft has been extensively remodeled, and exhibits several expanded regions of negative potential. A small region of positive potential at the upper lip of the active site cleft is maintained at wild type strength (blue lobe at left), as is a larger portion of positive potential distal to the active site cleft (protruding lobe at far right of image). Calculations performed and images rendered with YASARA Structure v9.10.5.

